US Election 1812 Map
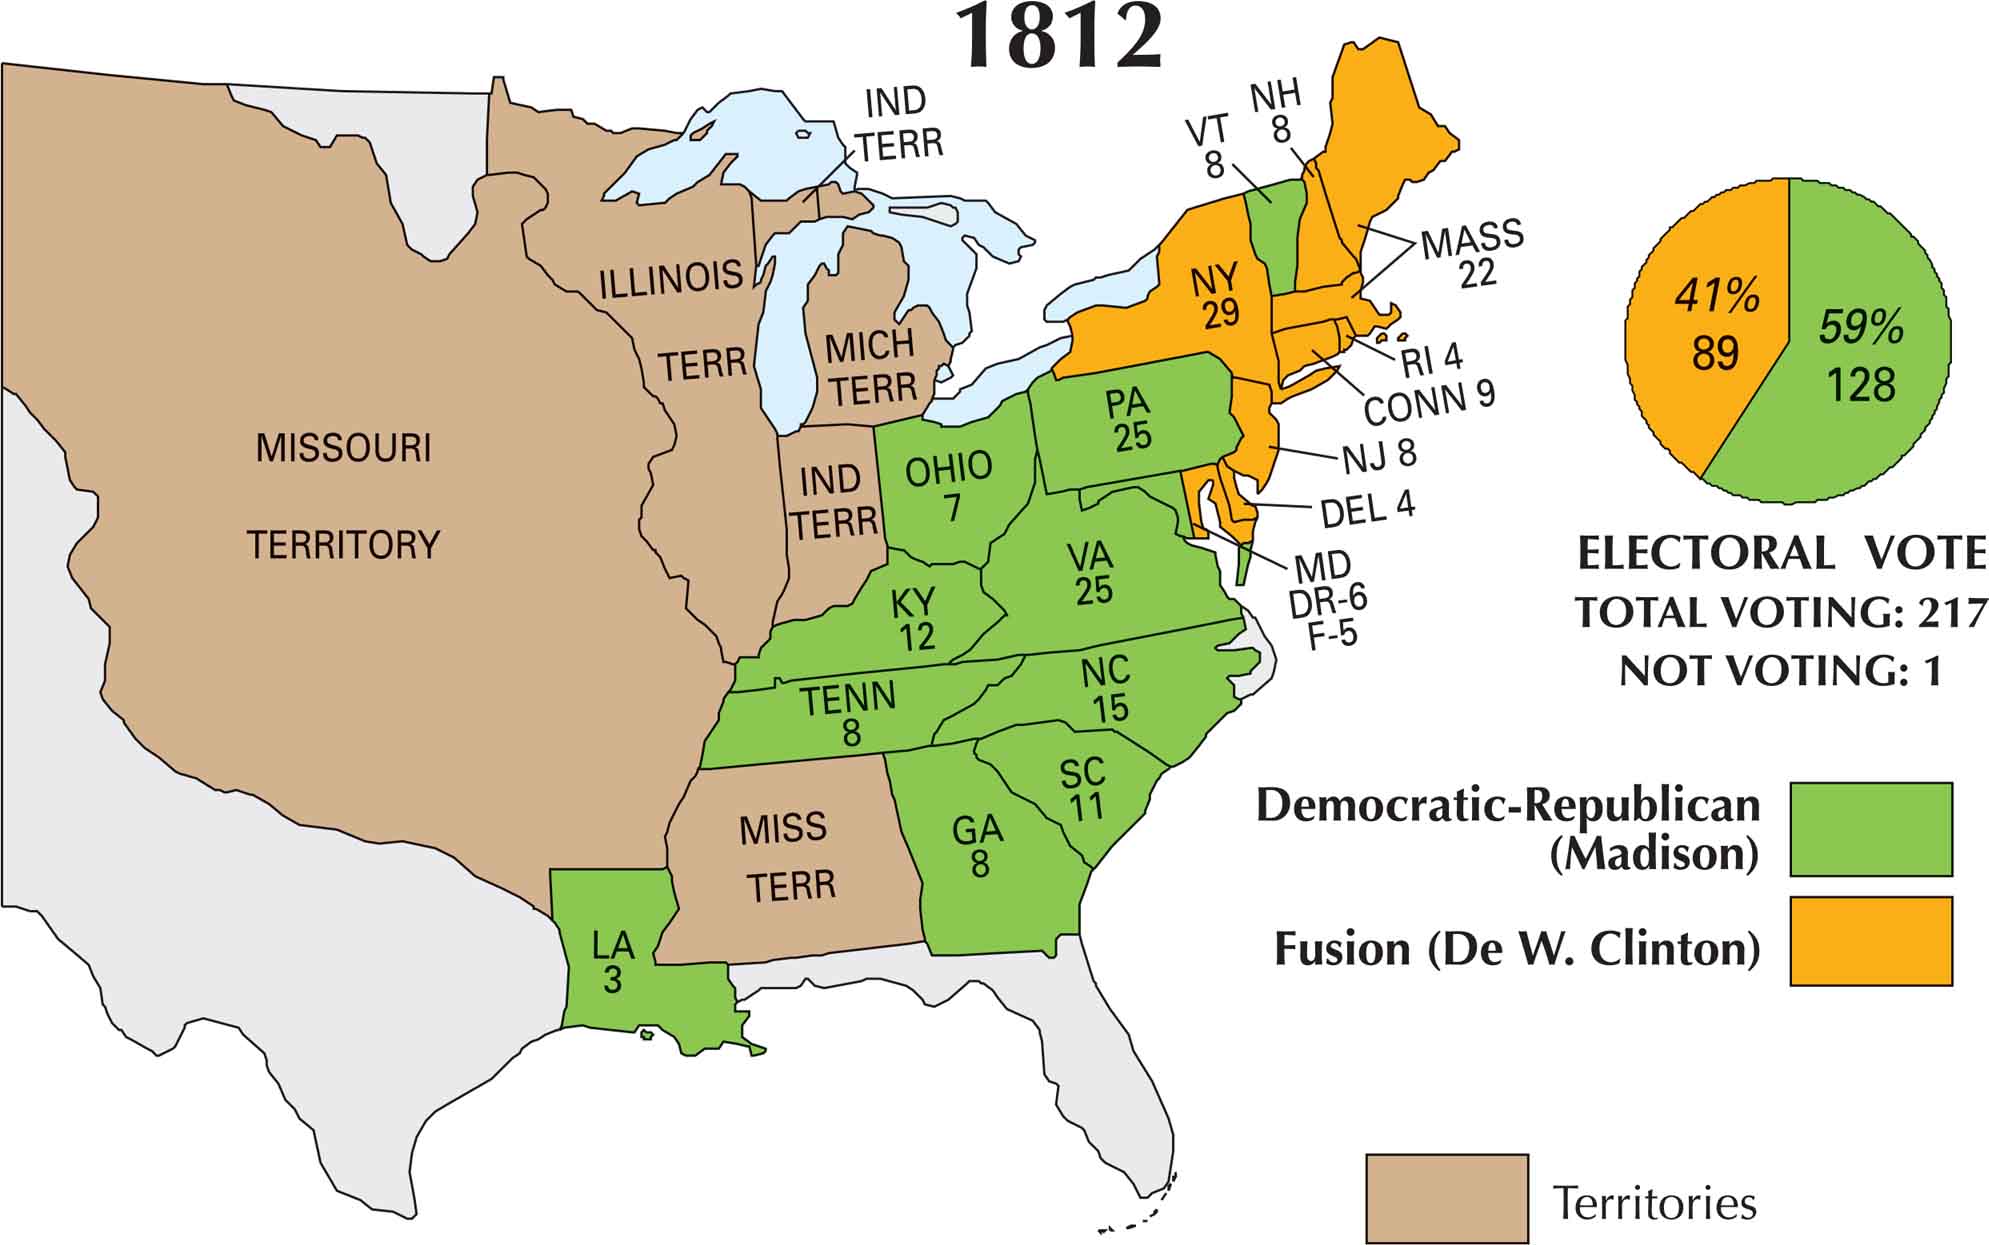
In 1812, the country was at war and deeply divided over it. James Madison was running for re-election as the War of 1812 raged against Britain, and not everyone thought it was a good idea. The Federalists regrouped in New England, railing against the conflict. They pushed their own candidate, DeWitt Clinton. It was a close, tense race. Our 1812 US election map captures the results.
Map Information
US Election Maps
Click on a map below to check out the US election map and results.


On the Map
Here are the states and their electoral votes, categorized by the Democratic-Republican (Madison) and Fusion (De W. Clinton) split:
States and Electoral Votes
|
State |
Total Votes |
Madison (DR) |
De W. Clinton (Fusion) |
|
New York |
29 |
0 |
29 |
|
Pennsylvania |
25 |
25 |
0 |
|
Virginia |
25 |
25 |
0 |
|
Massachusetts |
22 |
0 |
22 |
|
North Carolina |
15 |
15 |
0 |
|
Kentucky |
12 |
12 |
0 |
|
Maryland |
11 |
6 |
5 |
|
South Carolina |
11 |
11 |
0 |
|
Connecticut |
9 |
0 |
9 |
|
New Jersey |
8 |
0 |
8 |
|
New Hampshire |
8 |
0 |
8 |
|
Vermont |
8 |
8 |
0 |
|
Georgia |
8 |
8 |
0 |
|
Tennessee |
8 |
8 |
0 |
|
Ohio |
7 |
7 |
0 |
|
Rhode Island |
4 |
0 |
4 |
|
Delaware |
4 |
0 |
4 |
|
Louisiana |
3 |
3 |
0 |
Election Summary
- Total Voting: 217
- The Winner: James Madison (Democratic-Republican) with 128 votes (59%).
- New State: Louisiana (LA) participates for the first time with 3 electoral votes.
- Geographic Divide: The “Fusion” ticket dominated the Northeast (NY, NJ, and most of New England), while Madison swept the South and the emerging West.
- Updated Territories: The map now shows the Missouri Territory, Illinois Terr, Ind Terr, and Mich Terr.