US Election 1828 Map
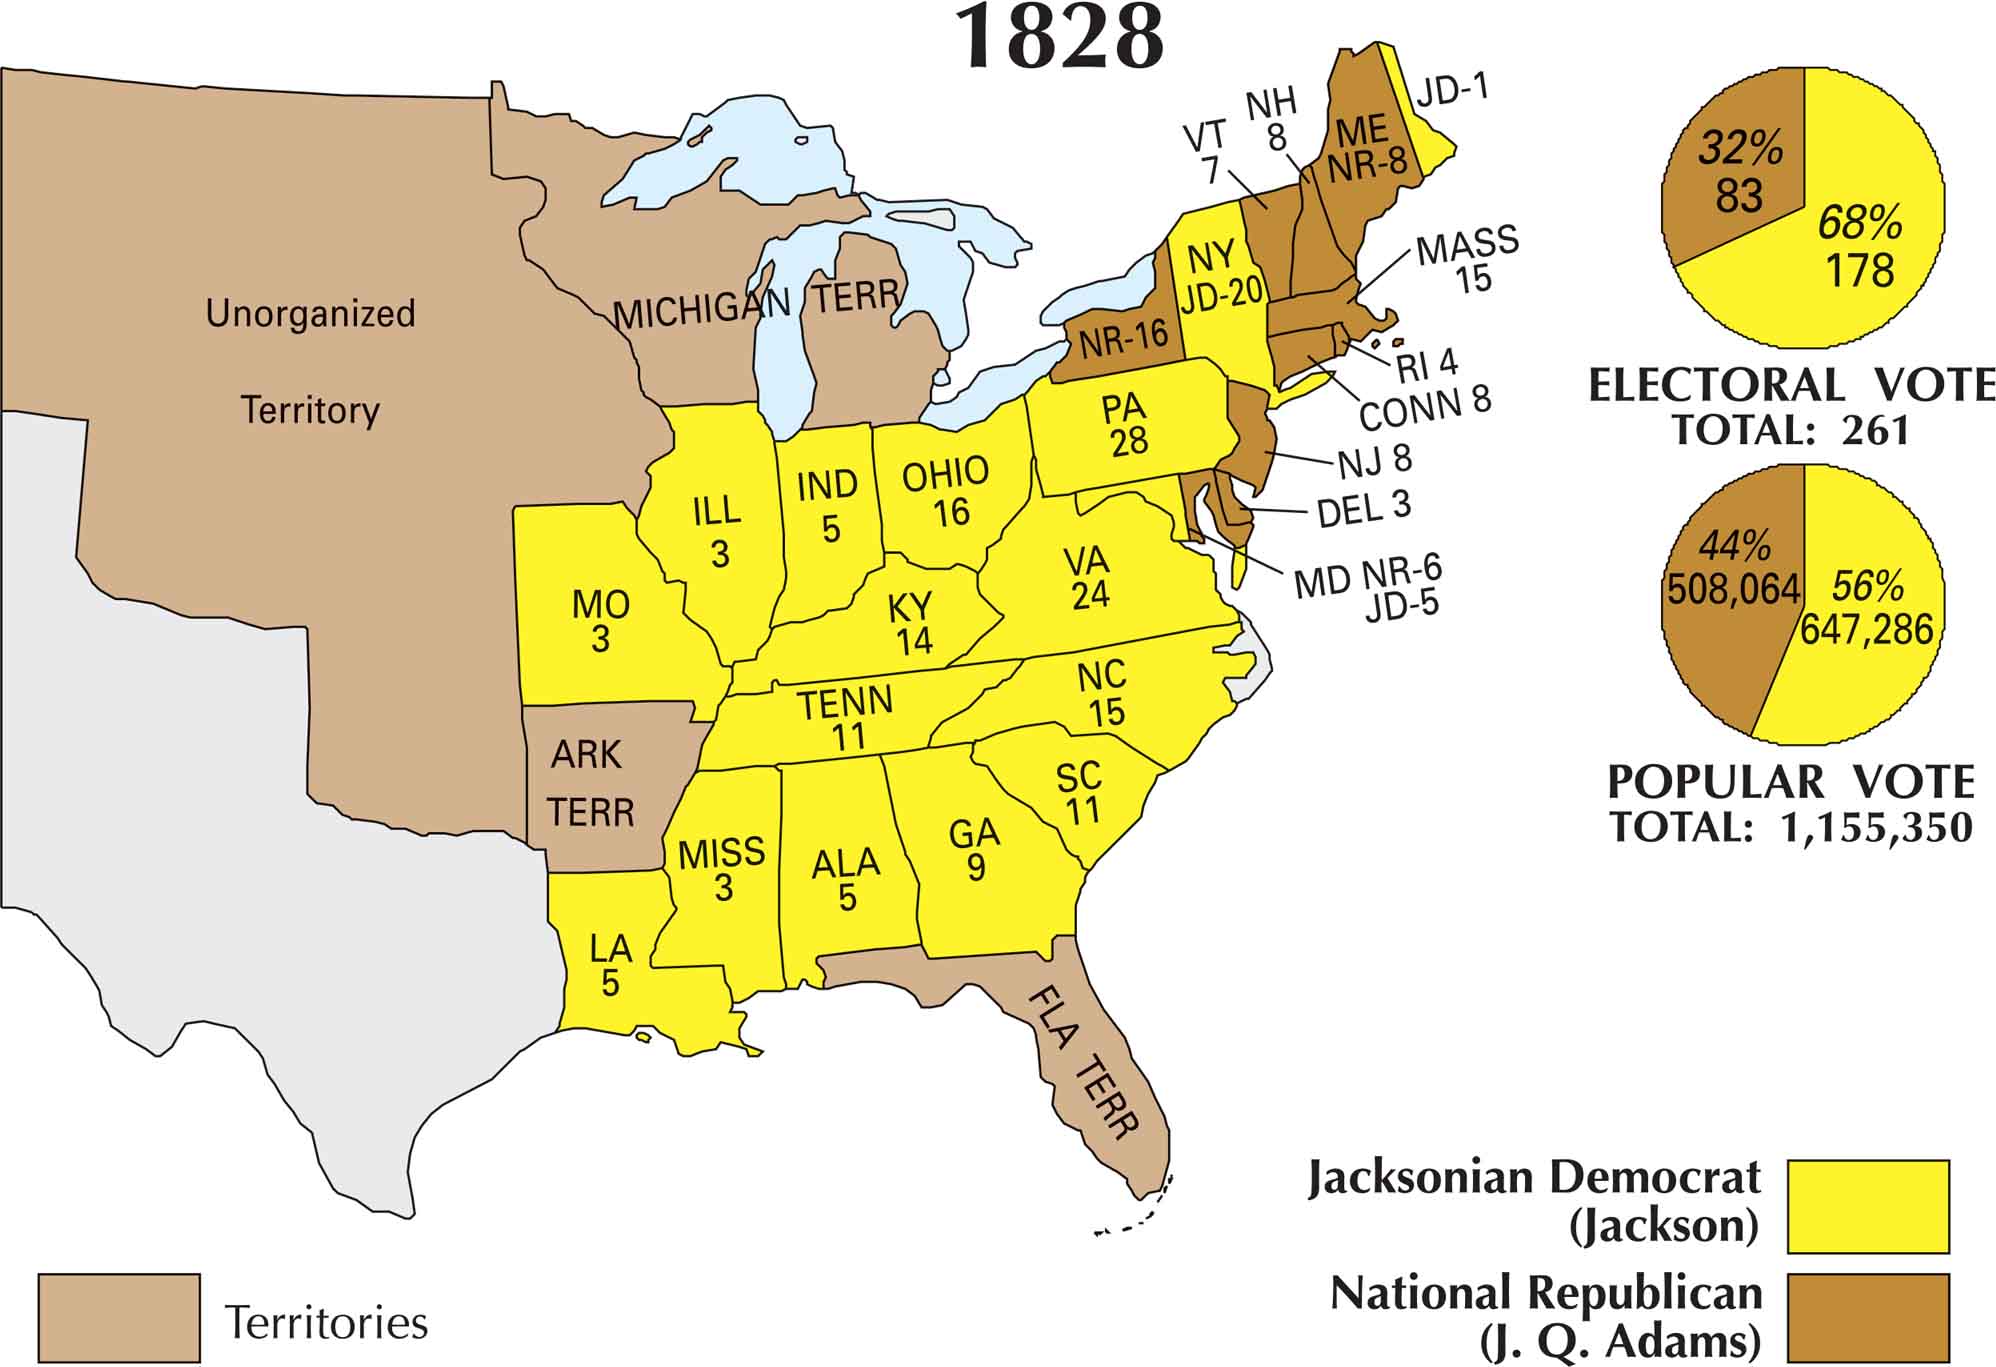
By 1828, politics had turned into a full-on showdown. Andrew Jackson was riding a wave of populist support. He challenged the incumbent John Quincy Adams. The campaign was rough and full of personal attacks. Looking at this map, Jackson’s victory is clear. He dominated the South and much of the West. Whereas Adams held on mostly in New England.
Map Information
US Election Maps
Click on a map below to check out the US election map and results.


On the Map
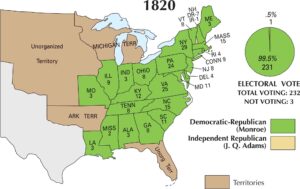
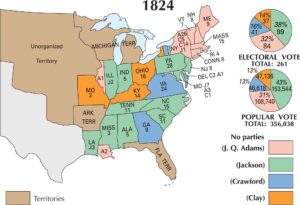
Here is the distribution of states and their electoral votes between the Jacksonian Democrats (Jackson) and the National Republicans (J. Q. Adams):
States and Electoral Votes
|
State |
Total Votes |
Jackson (JD) |
J. Q. Adams (NR) |
|
New York |
36 |
20 |
16 |
|
Pennsylvania |
28 |
28 |
0 |
|
Virginia |
24 |
24 |
0 |
|
Ohio |
16 |
16 |
0 |
|
Massachusetts |
15 |
0 |
15 |
|
North Carolina |
15 |
15 |
0 |
|
Kentucky |
14 |
14 |
0 |
|
South Carolina |
11 |
11 |
0 |
|
Tennessee |
11 |
11 |
0 |
|
Georgia |
9 |
9 |
0 |
|
Maine |
9 |
1 |
8 |
|
Maryland |
11 |
5 |
6 |
|
Connecticut |
8 |
0 |
8 |
|
New Hampshire |
8 |
0 |
8 |
|
New Jersey |
8 |
0 |
8 |
|
Vermont |
7 |
0 |
7 |
|
Alabama |
5 |
5 |
0 |
|
Indiana |
5 |
5 |
0 |
|
Louisiana |
5 |
5 |
0 |
|
Rhode Island |
4 |
0 |
4 |
|
Delaware |
3 |
0 |
3 |
|
Illinois |
3 |
3 |
0 |
|
Mississippi |
3 |
3 |
0 |
|
Missouri |
3 |
3 |
0 |
Election Summary
- Total Electoral Votes: 261
- The Winner: Andrew Jackson (68%) with 178 votes.
- Popular Vote: Totaling 1,155,350. Jackson won with 56% (647,286 votes).
- Significant Shifts: Jackson dominated the South and West, but notably flipped New York (partial) and Pennsylvania compared to Adams’ previous strength.