Alaska Zip Code Map
Alaska’s zip codes all start with 99 and stretch long and far. This map plots them from south to north, Anchorage to the Arctic.
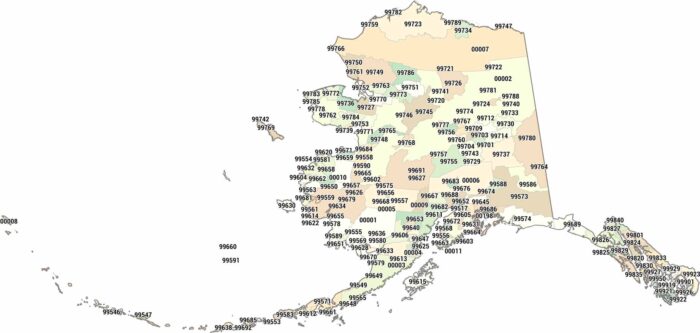
Alaska’s zip codes all start with 99 and stretch long and far. This map plots them from south to north, Anchorage to the Arctic.
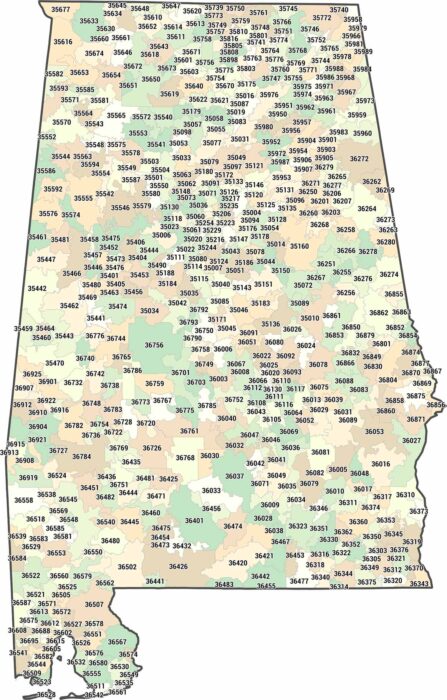
Looking for a specific Alabama zip code? The state ranges from 35000 to 36999. See every Alabama zip code mapped out in one place.
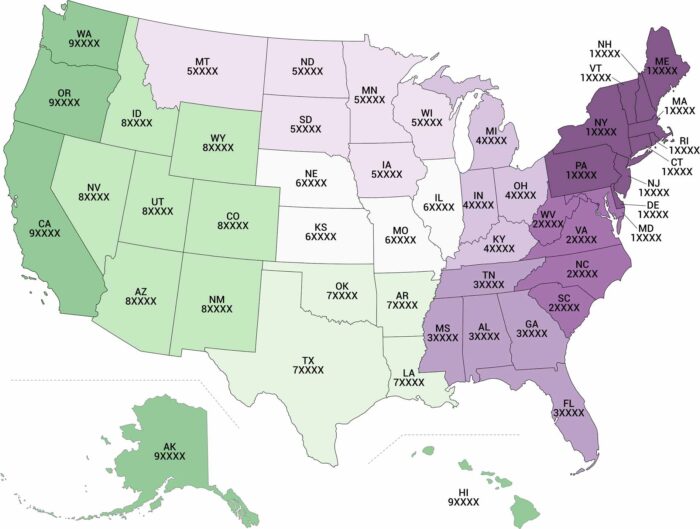
See how zip codes are organized across America. Our US zip code map breaks it down by listing its own zip code range.
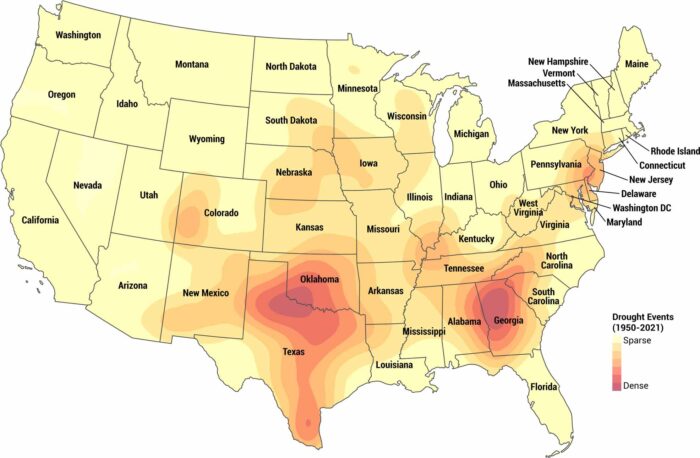
Seventy years of drought data laid out in one place. This map tracks drought conditions across America from 1950 to 2021.
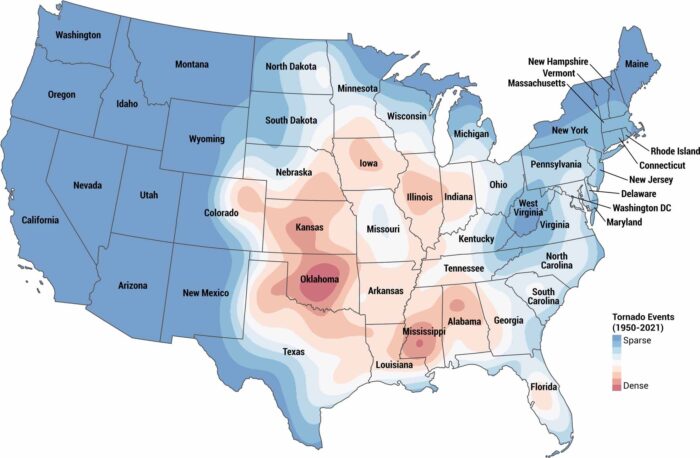
Where do tornadoes hit hardest? Seventy years of tornado data in one map. The darkest spots are Oklahoma, Texas, Mississippi, and Georgia.
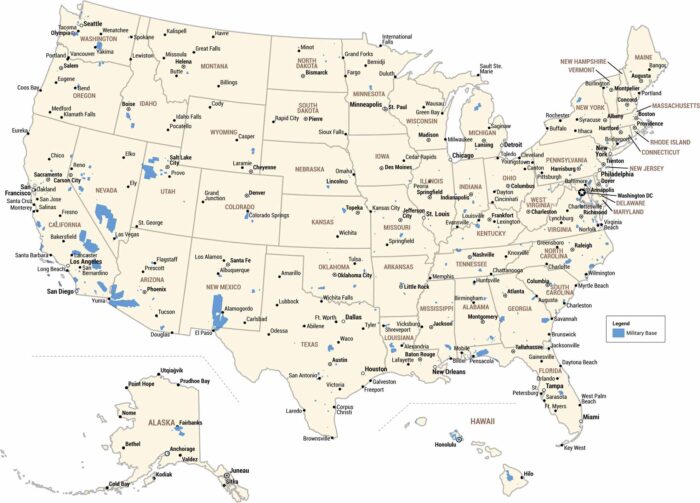
The US military has hundreds of bases spread across the country. This military bases map shows you where they all are.
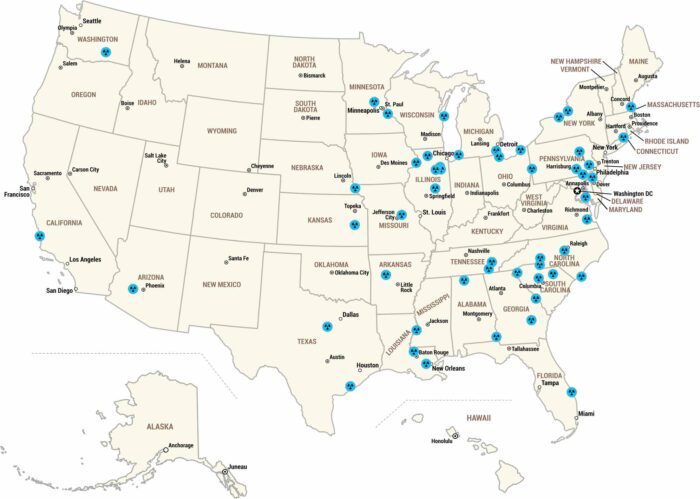
Nuclear energy powers millions of American homes. This map shows you where all the plants are in the United States.
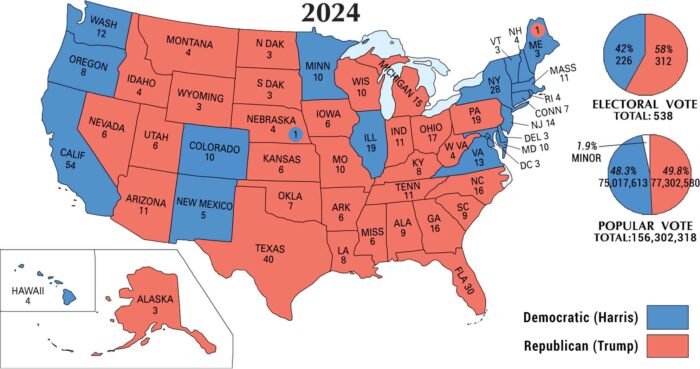
See how America voted recently and every election before it. This US political map shows which states went red or blue across US history.
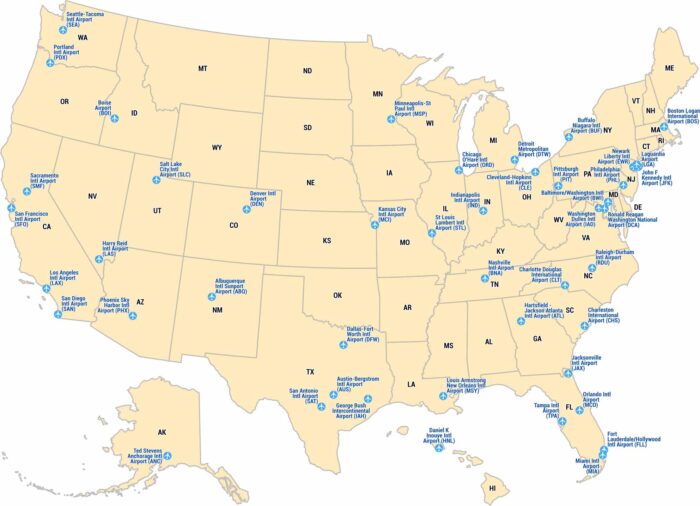
Flying somewhere? This map shows you where airports are across the United States. Use it to find airports near you or plan your next trip.
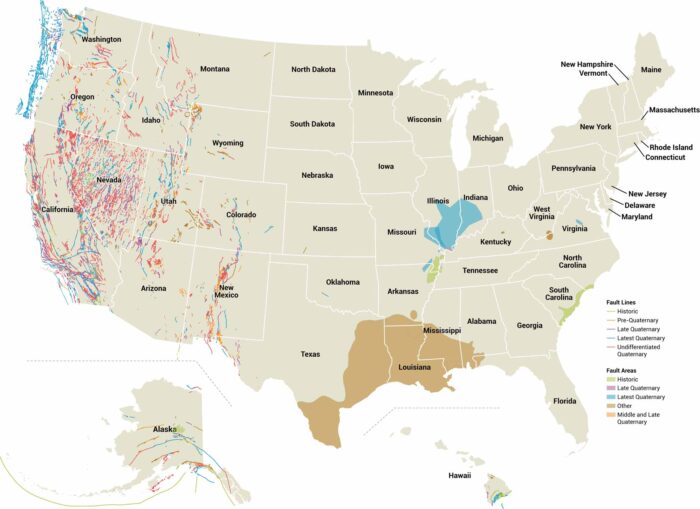
This US fault lines map plots major fracture zones. California’s San Andreas gets most of the spotlight. But it’s not just on the West Coast.
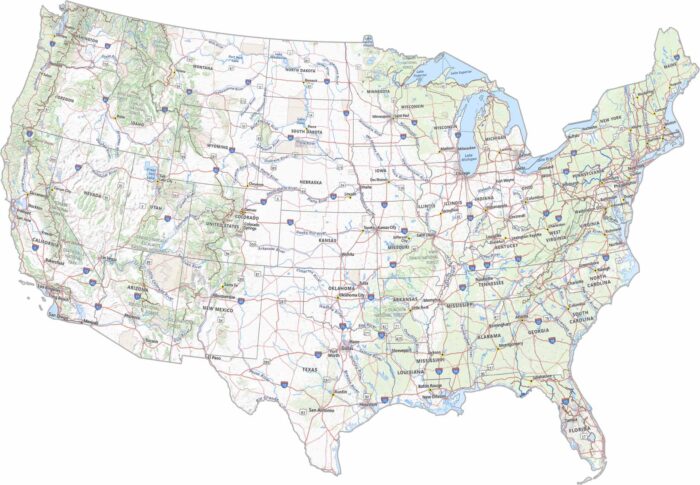
This US topographic map packs in terrain features, state outlines and interstates. Our map of US topography doesn’t hold back on detail.
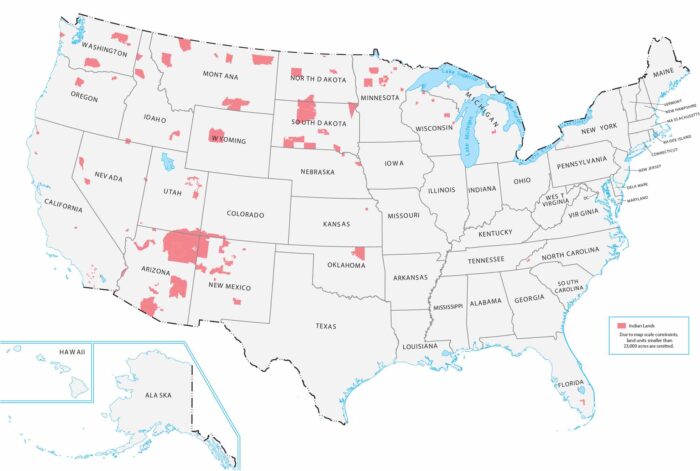
Reservations occupy way more territory than most people realize. This US Native American Reservations map plots tribal lands.
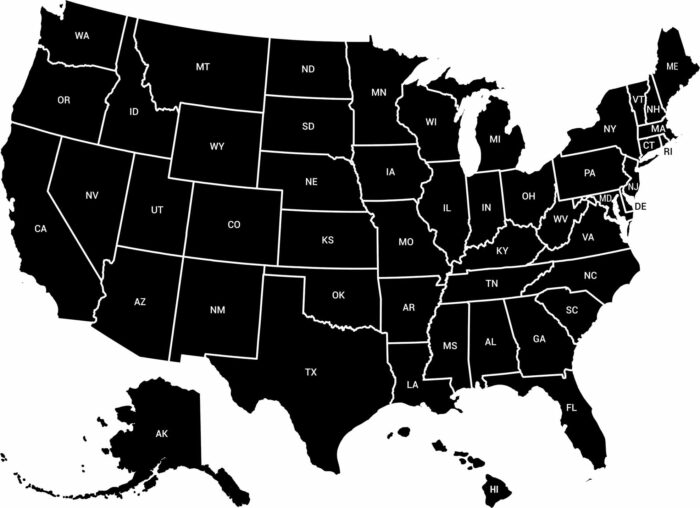
Contrast makes everything clearer. And this design proves it. This map goes minimal with white outlines and abbreviations on solid black.
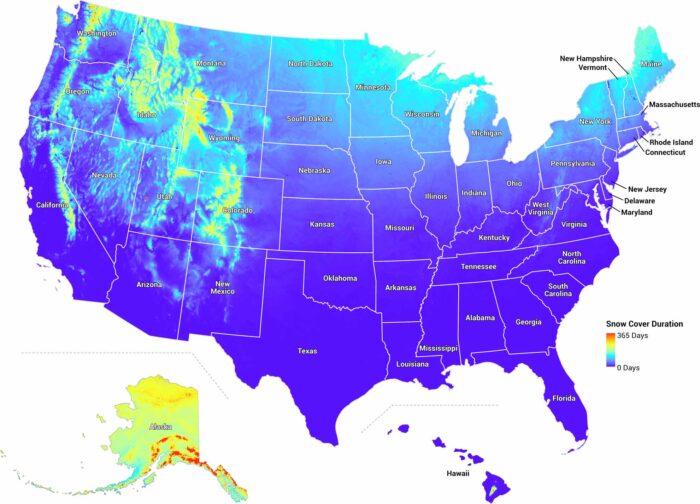
Our map of US snowfall breaks down how many days it stays blanketed in snow. There’s a huge gap between Minnesota and the south.
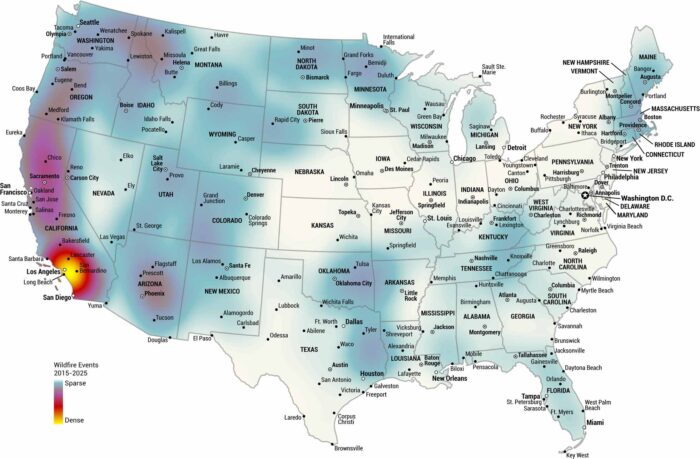
Where have wildfires hit hardest over the past decade? This US wildfire map tracks hotspots from 2015 to 2025, with California most dense.