US Election 1852 Map

This map of the 1852 election looks calmer than it really was. On the surface, it shows a sweeping win for Franklin Pierce, the Democratic candidate. That’s right. Blue stretches across nearly every state. But underneath that sea of color, the old Whig Party was collapsing holding only a few states in the Northeast.
Map Information
US Election Maps
Click on a map below to check out the US election map and results.

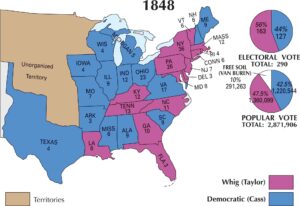
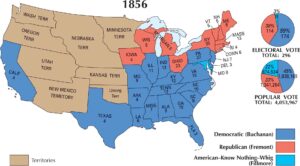
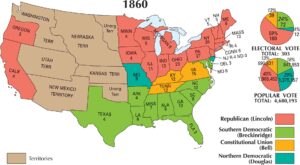
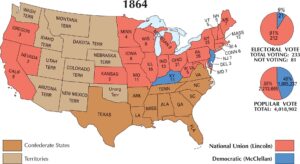
On the Map
Here is the state-by-state electoral breakdown for the 1852 Presidential Election and a look at the massive expansion of the United States since its first election in 1789.
States and Electoral Votes
|
State |
Total Votes |
Pierce (D) |
Scott (Whig) |
|
New York |
35 |
35 |
0 |
|
Pennsylvania |
27 |
27 |
0 |
|
Ohio |
23 |
23 |
0 |
|
Virginia |
15 |
15 |
0 |
|
Massachusetts |
13 |
0 |
13 |
|
Indiana |
13 |
13 |
0 |
|
Tennessee |
12 |
0 |
12 |
|
Kentucky |
12 |
0 |
12 |
|
Illinois |
11 |
11 |
0 |
|
North Carolina |
10 |
10 |
0 |
|
Georgia |
10 |
10 |
0 |
|
Alabama |
9 |
9 |
0 |
|
Missouri |
9 |
9 |
0 |
|
Maine |
8 |
8 |
0 |
|
Maryland |
8 |
8 |
0 |
|
South Carolina |
8 |
8 |
0 |
|
New Jersey |
7 |
7 |
0 |
|
Mississippi |
7 |
7 |
0 |
|
Michigan |
6 |
6 |
0 |
|
Louisiana |
6 |
6 |
0 |
|
New Hampshire |
5 |
5 |
0 |
|
Vermont |
5 |
0 |
5 |
|
Wisconsin |
5 |
5 |
0 |
|
Connecticut |
6 |
6 |
0 |
|
Rhode Island |
4 |
4 |
0 |
|
Arkansas |
4 |
4 |
0 |
|
Iowa |
4 |
4 |
0 |
|
Texas |
4 |
4 |
0 |
|
California |
4 |
4 |
0 |
|
Delaware |
3 |
3 |
0 |
|
Florida |
3 |
3 |
0 |
Election Summary
- Winner: Franklin Pierce (Democrat) won 254 electoral votes (86%).
- Popular Vote: Totaled 3,143,679, Pierce won 51% (1,601,274).
- Third Party: The Free Soil Party (Hale) took 5% of the popular vote (155,825).
- New State: California (4) participated in its first presidential election.