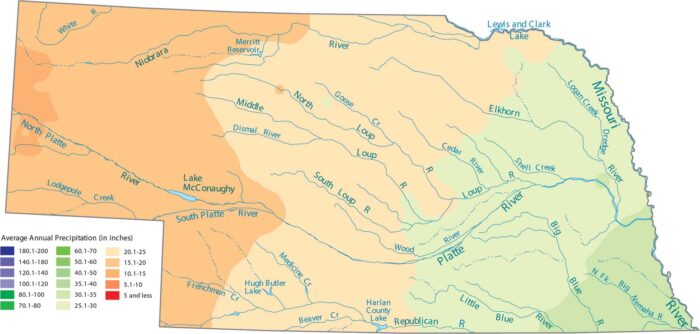
Nebraska Precipitation Map
Our precipitation map of Nebraska shows that the eastern border is the wettest area. See As you head west, this creates drier conditions.
Our precipitation map of Nebraska shows that the eastern border is the wettest area. See As you head west, this creates drier conditions.
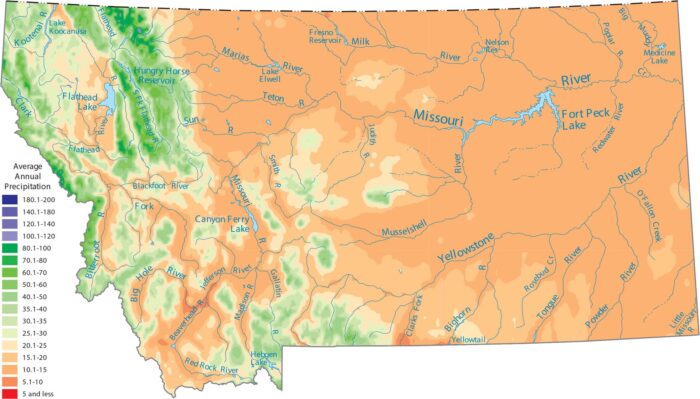
Our precipitation map of Montana shows moisture trapped by terrain. Plains in the eastern region of Montana stay dry behind mountain ranges.
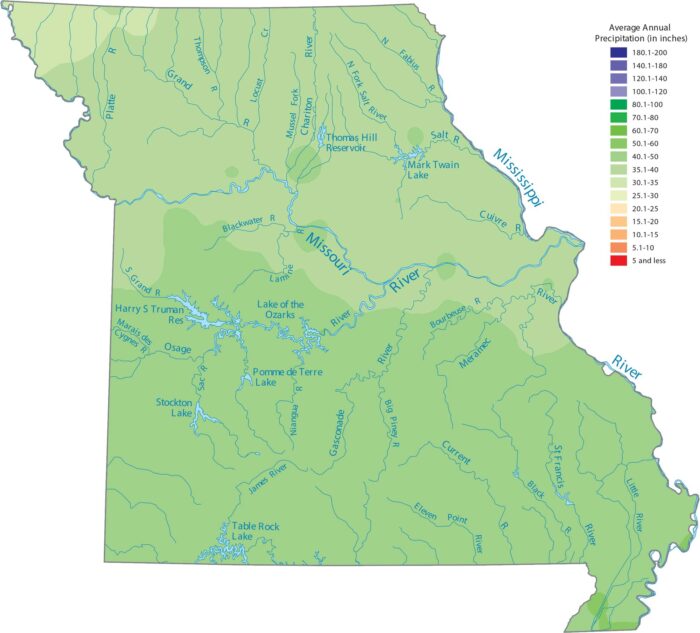
Missouri sees the most rain in the southeastern lowlands region. Our precipitation map of Missouri reflects this contrast.
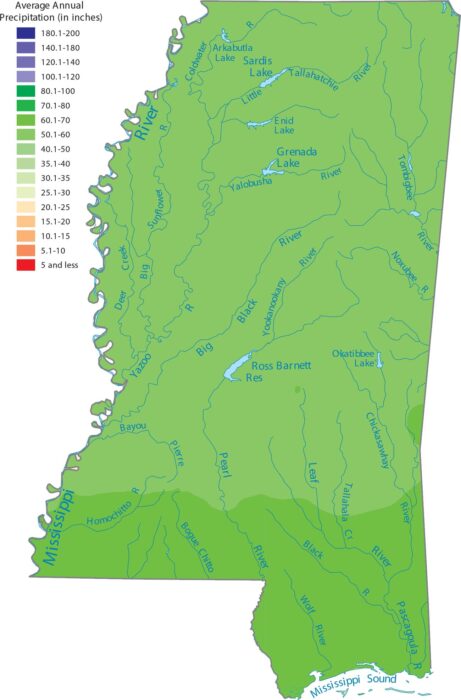
Mississippi is one of the wettest states because of its location along the Gulf Coast. Our precipitation map of Mississippi shows wetness.
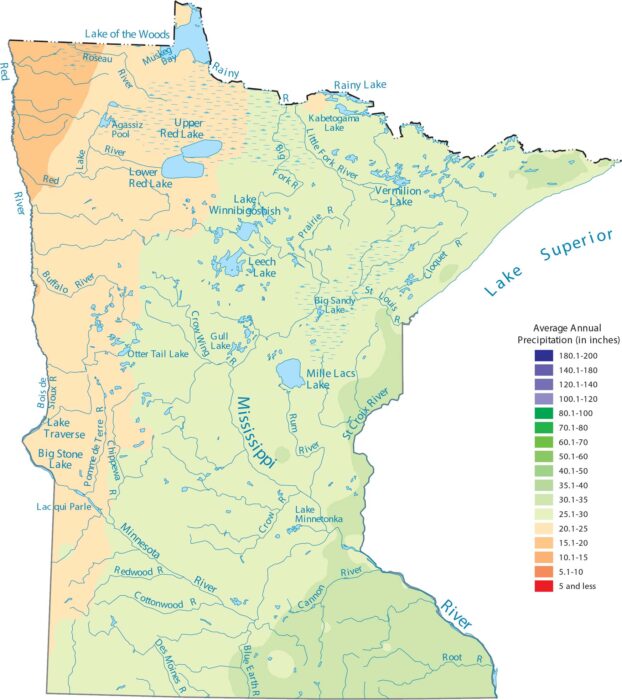
Our precipitation map of Minnesota shows rainfall increasing as you head southeast. The northern latitude gets snow and less precipitation.
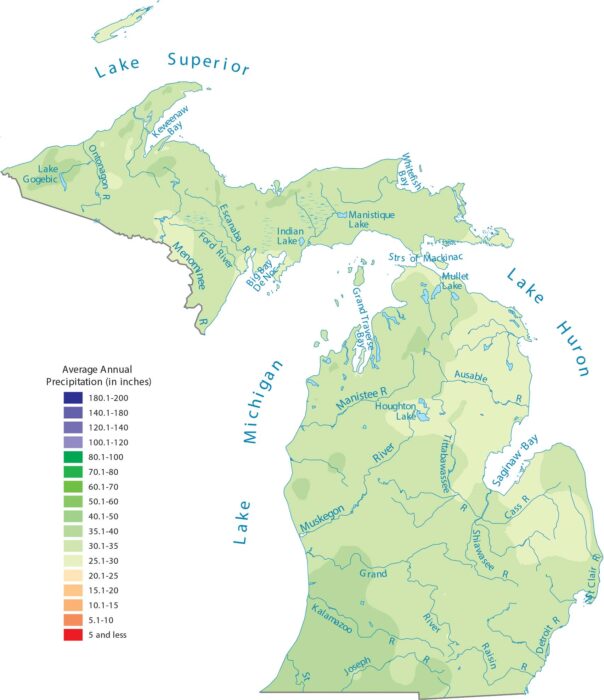
Large lakes influence weather because they surround it on almost all sides. Our precipitation map of Michigan shows water-driven patterns.
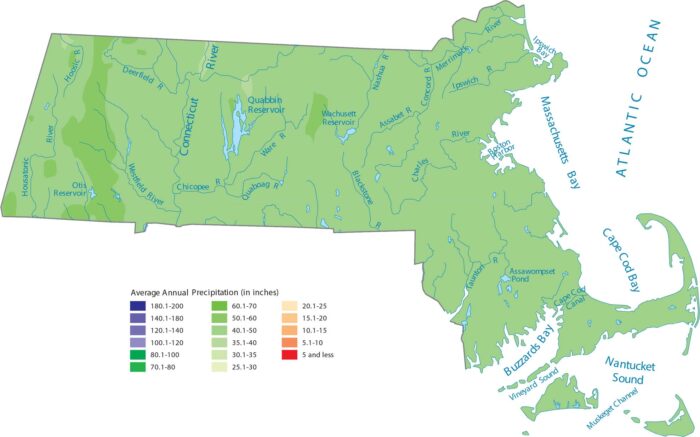
Massachusetts gets a steady supply of rain and snow coming off the ocean. Also, geography changes quickly from coast to mountains.
Geography changes quickly from coast to mountains. Western highlands and coastal regions appear wetter on the map.
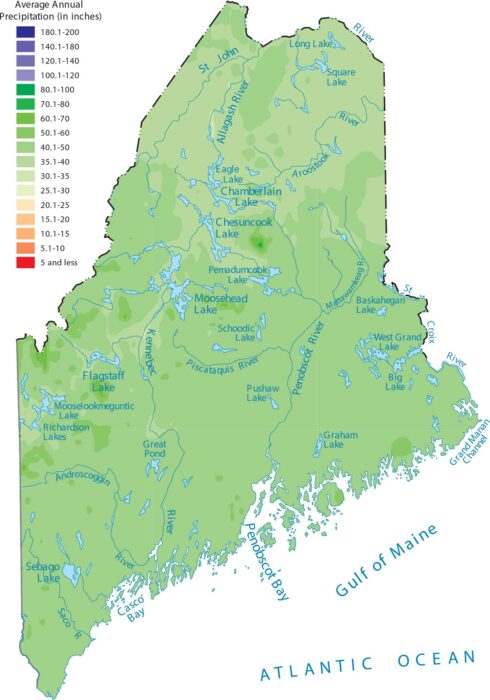
Our precipitation map of Maine reflects strong ocean influence. Atlantic storms reach the state with little resistance.
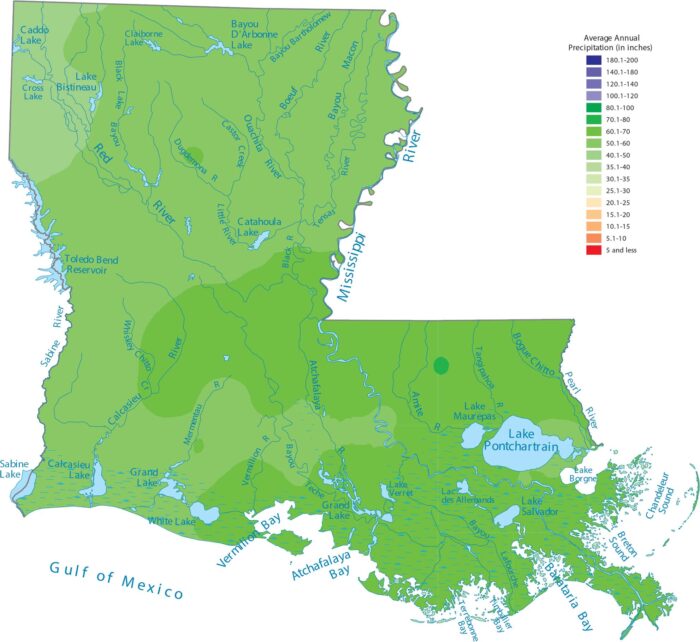
Our precipitation map of Louisiana shows its position on the Gulf Coast. This explains why it’s one of the wettest states.
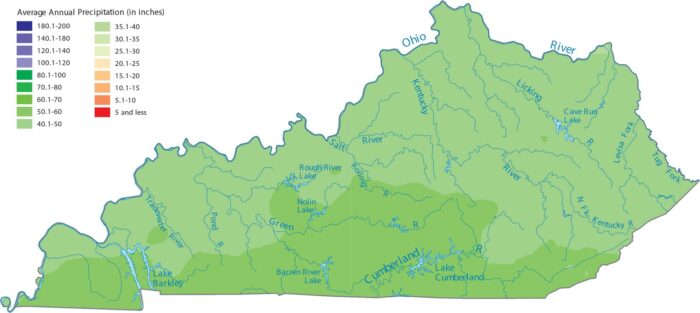
Our precipitation map of Kentucky shows the southern region getting the most rain because it sits between the Gulf and the Appalachians.
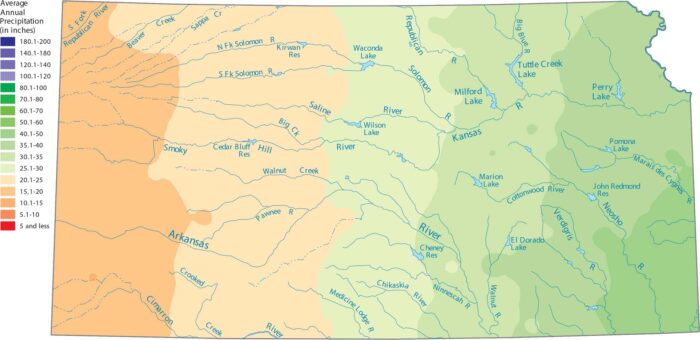
Eastern Kansas appears wetter on the map than the High Plains. Our precipitation map of Kansas shows this steady transition.
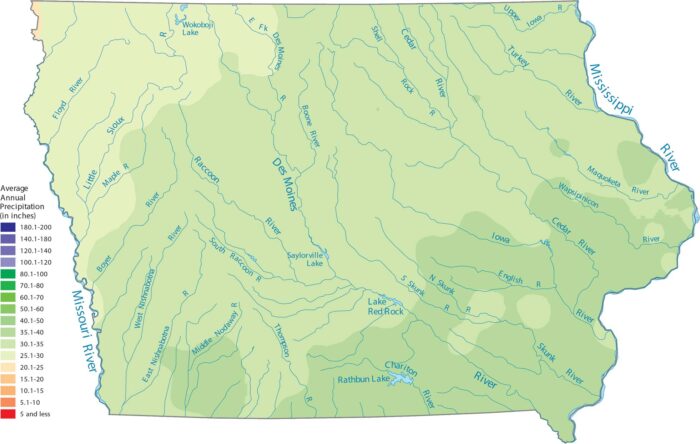
Our precipitation map of Iowa shows that the southeast corner is the wettest. The northwest is a bit drier closer to the Great Plains.
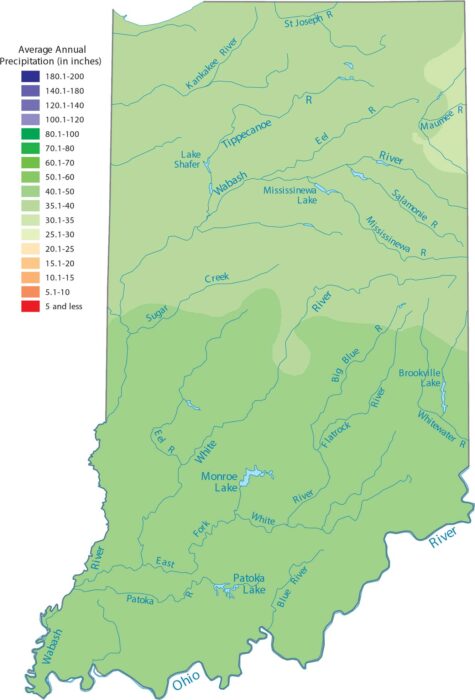
Our precipitation map of Indiana shows rainfall spread pretty evenly. The terrain is flat here so it doesn’t create any barriers.
Open, flat land lets weather systems pass freely. Our precipitation map shows fairly even precipitation statewide.