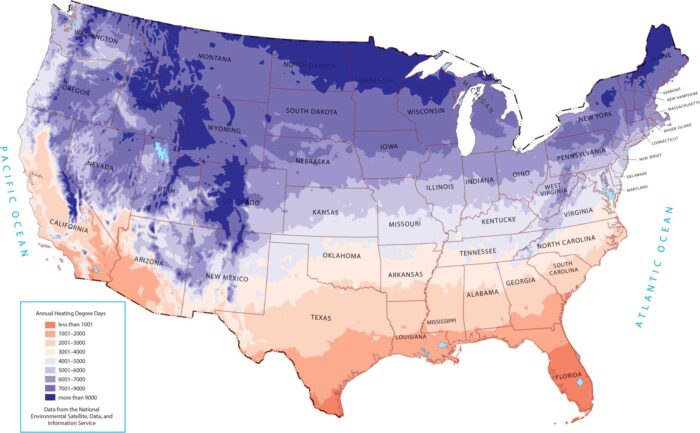
US Mean Annual Heating Degree Days Map
As shown on our map, heating demand increases moving north and into higher elevations. The deep South shows the exact opposite.
As shown on our map, heating demand increases moving north and into higher elevations. The deep South shows the exact opposite.
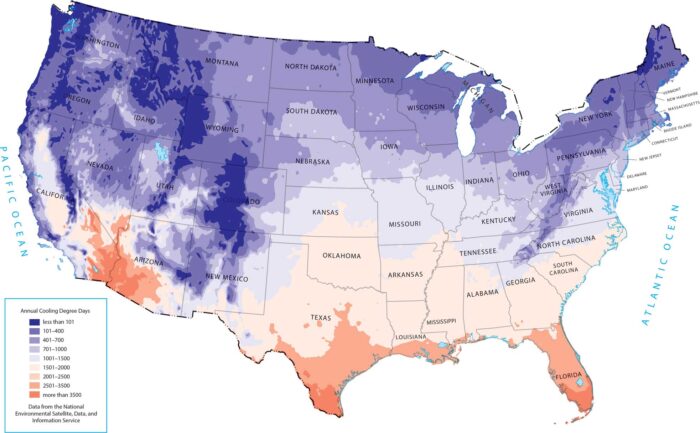
This map highlights where cooling demand is greatest. Southern states and desert regions stand out because of high temperatures.
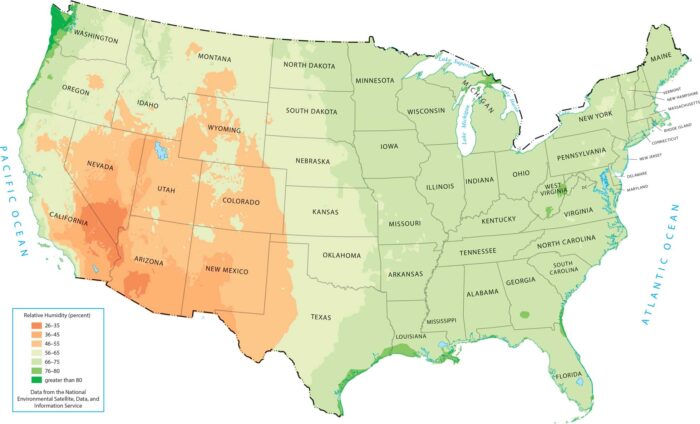
Our map shows how the United States gets progressively more humid as you move from the dry West to the moisture-rich East.
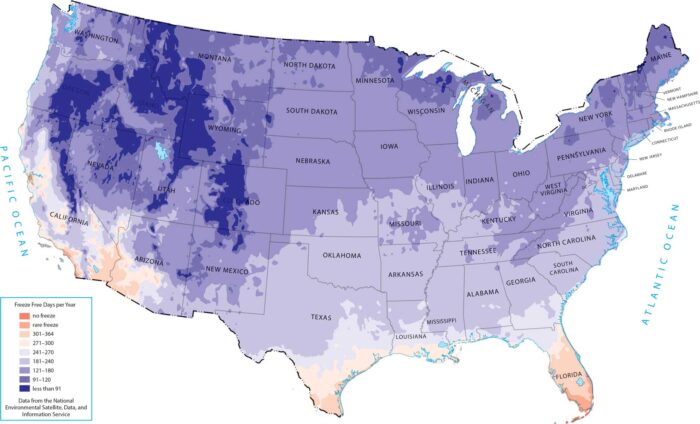
Our map reflects how latitude and ocean control growing seasons. The freeze-free period grows longer as you move south and toward the coasts.
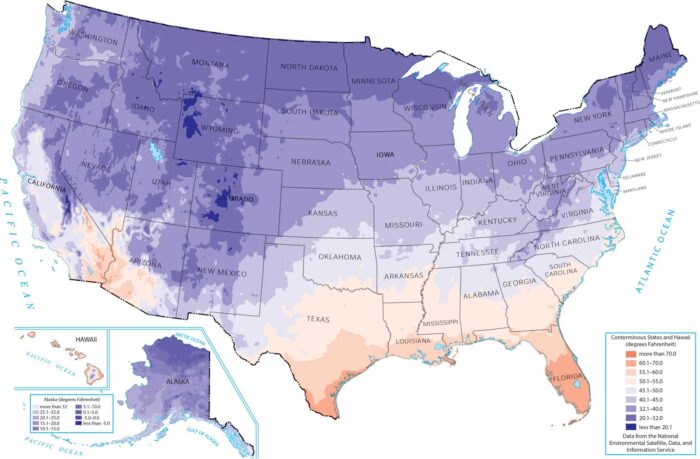
Our minimum temperature map reveals how northern states and high-elevation areas experience the coldest overnight lows throughout the year.
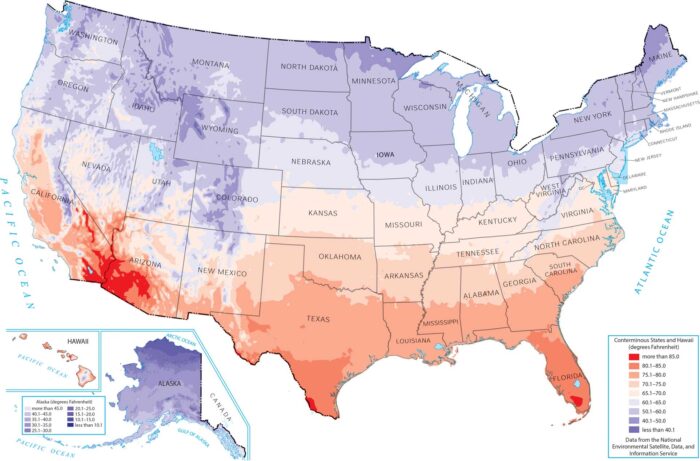
This map shows how maximum temperature varies across the country. It shows how latitude, elevation, and desert geography drive temperature.
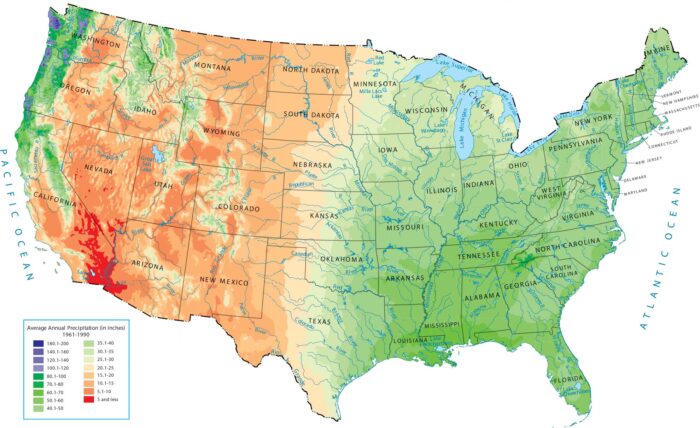
Our US precipitation map shows a huge split. The eastern half and the Northwest are green, while the west interior is a giant dry zone.
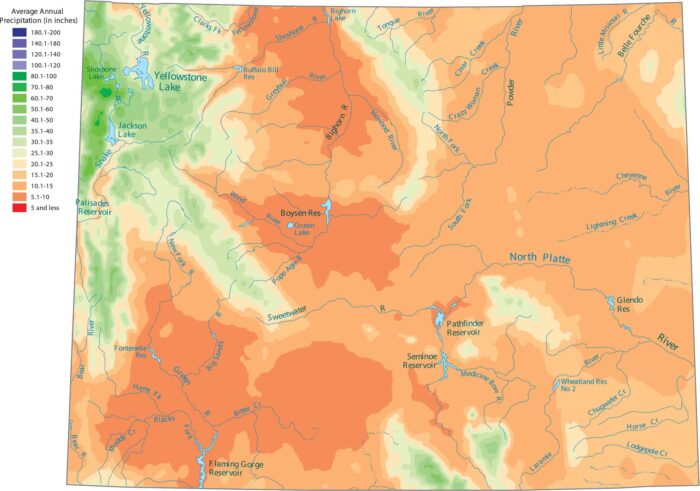
Wyoming is one of the driest states. Our precipitation map of Wyoming shows that the only wet areas are the high mountain ranges.
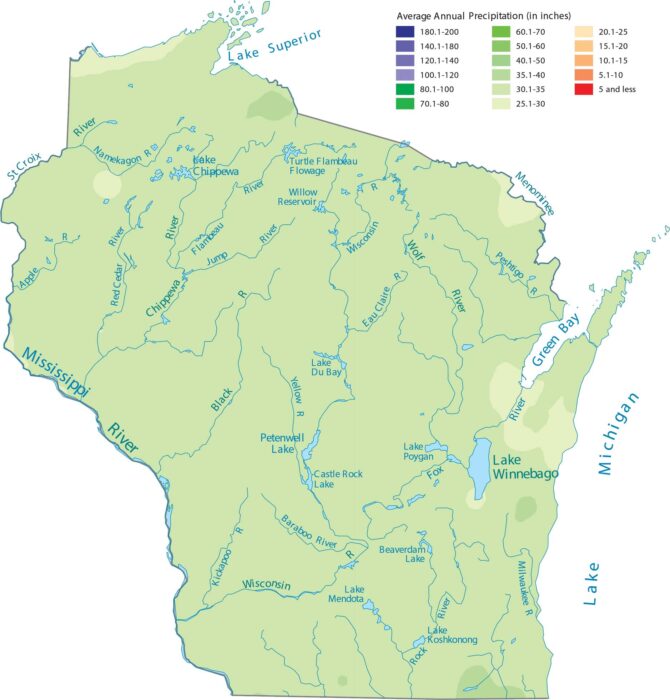
Wisconsin sees above average precipitation because of lake-effect moisture. See the change in precipitation on our map.
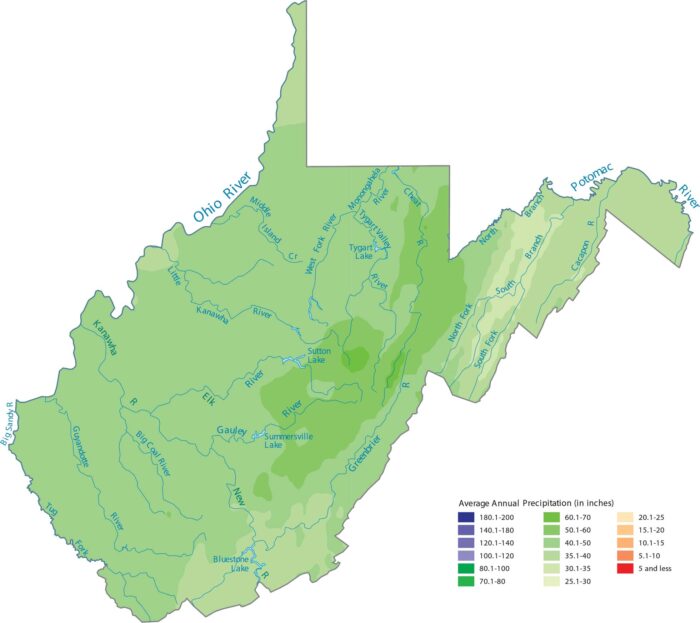
West Virginia has mountainous terrain. Our precipitation map of West Virginia reflects how the ridges appear wetter.
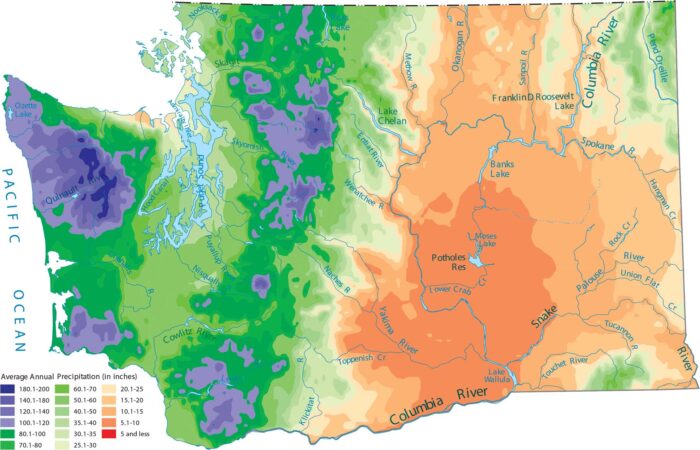
Washington is known for its rain. Our precipitation map of Washington shows that the Olympic Mountains and the Cascades get the most water.
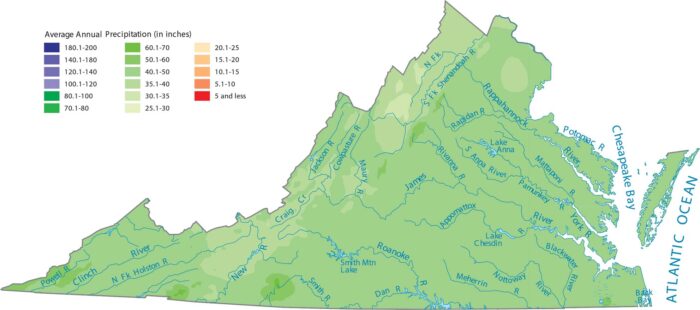
Virginia’s precipitation increases as you move from the coast inland toward the Blue Ridge Mountains. It decreases in the valleys beyond.
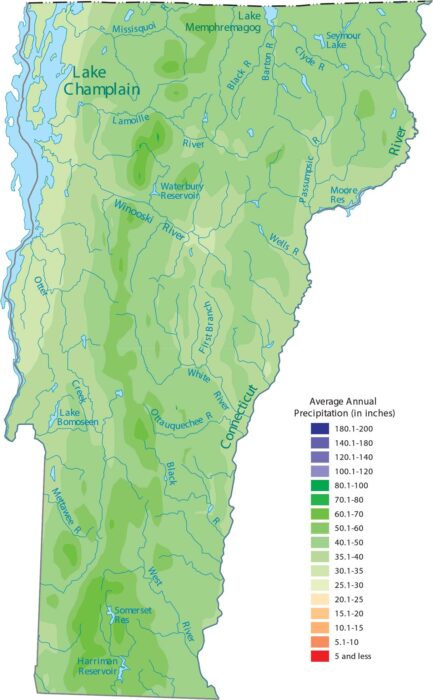
Vermont gets a lot of precipitation. Our precipitation map of Vermont shows higher elevations like the Green Mountains appearing wetter.
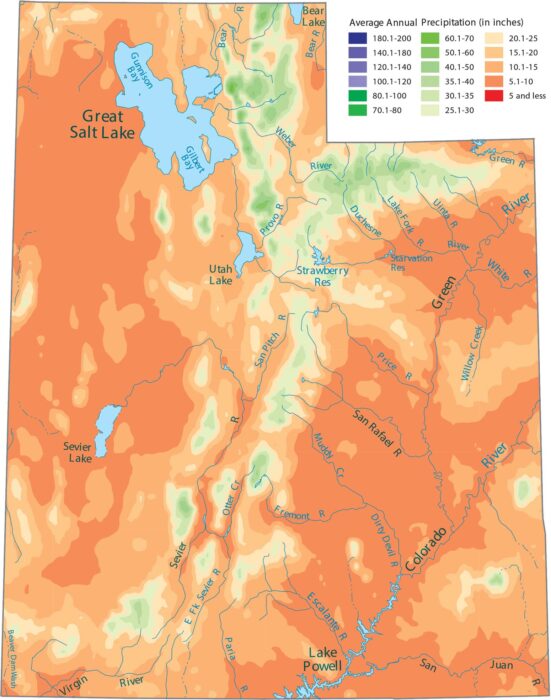
Desert basins dominate much of the state. Our precipitation map of Utah shows that the Wasatch Range in the center gets the most moisture.
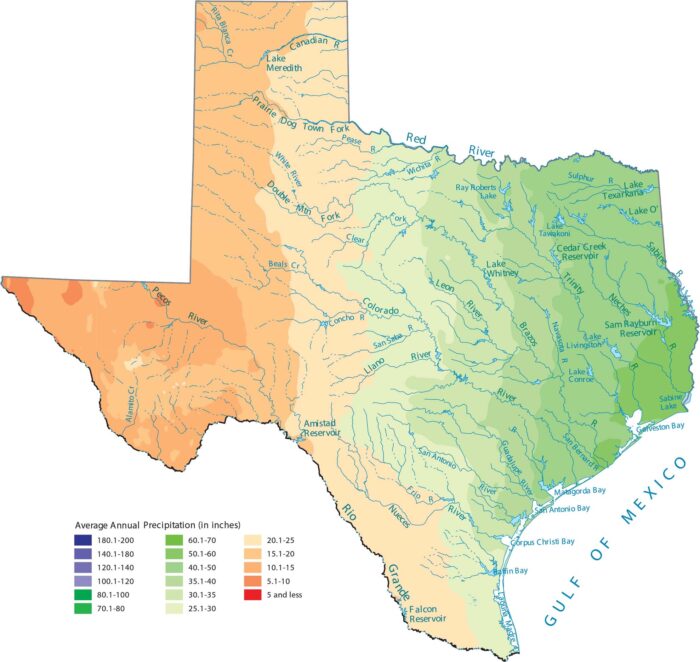
From its wet eastern forests to the bone-dry deserts, Texas shows maybe the most dramatic precipitation gradient in the country.