US Election 1880 Map
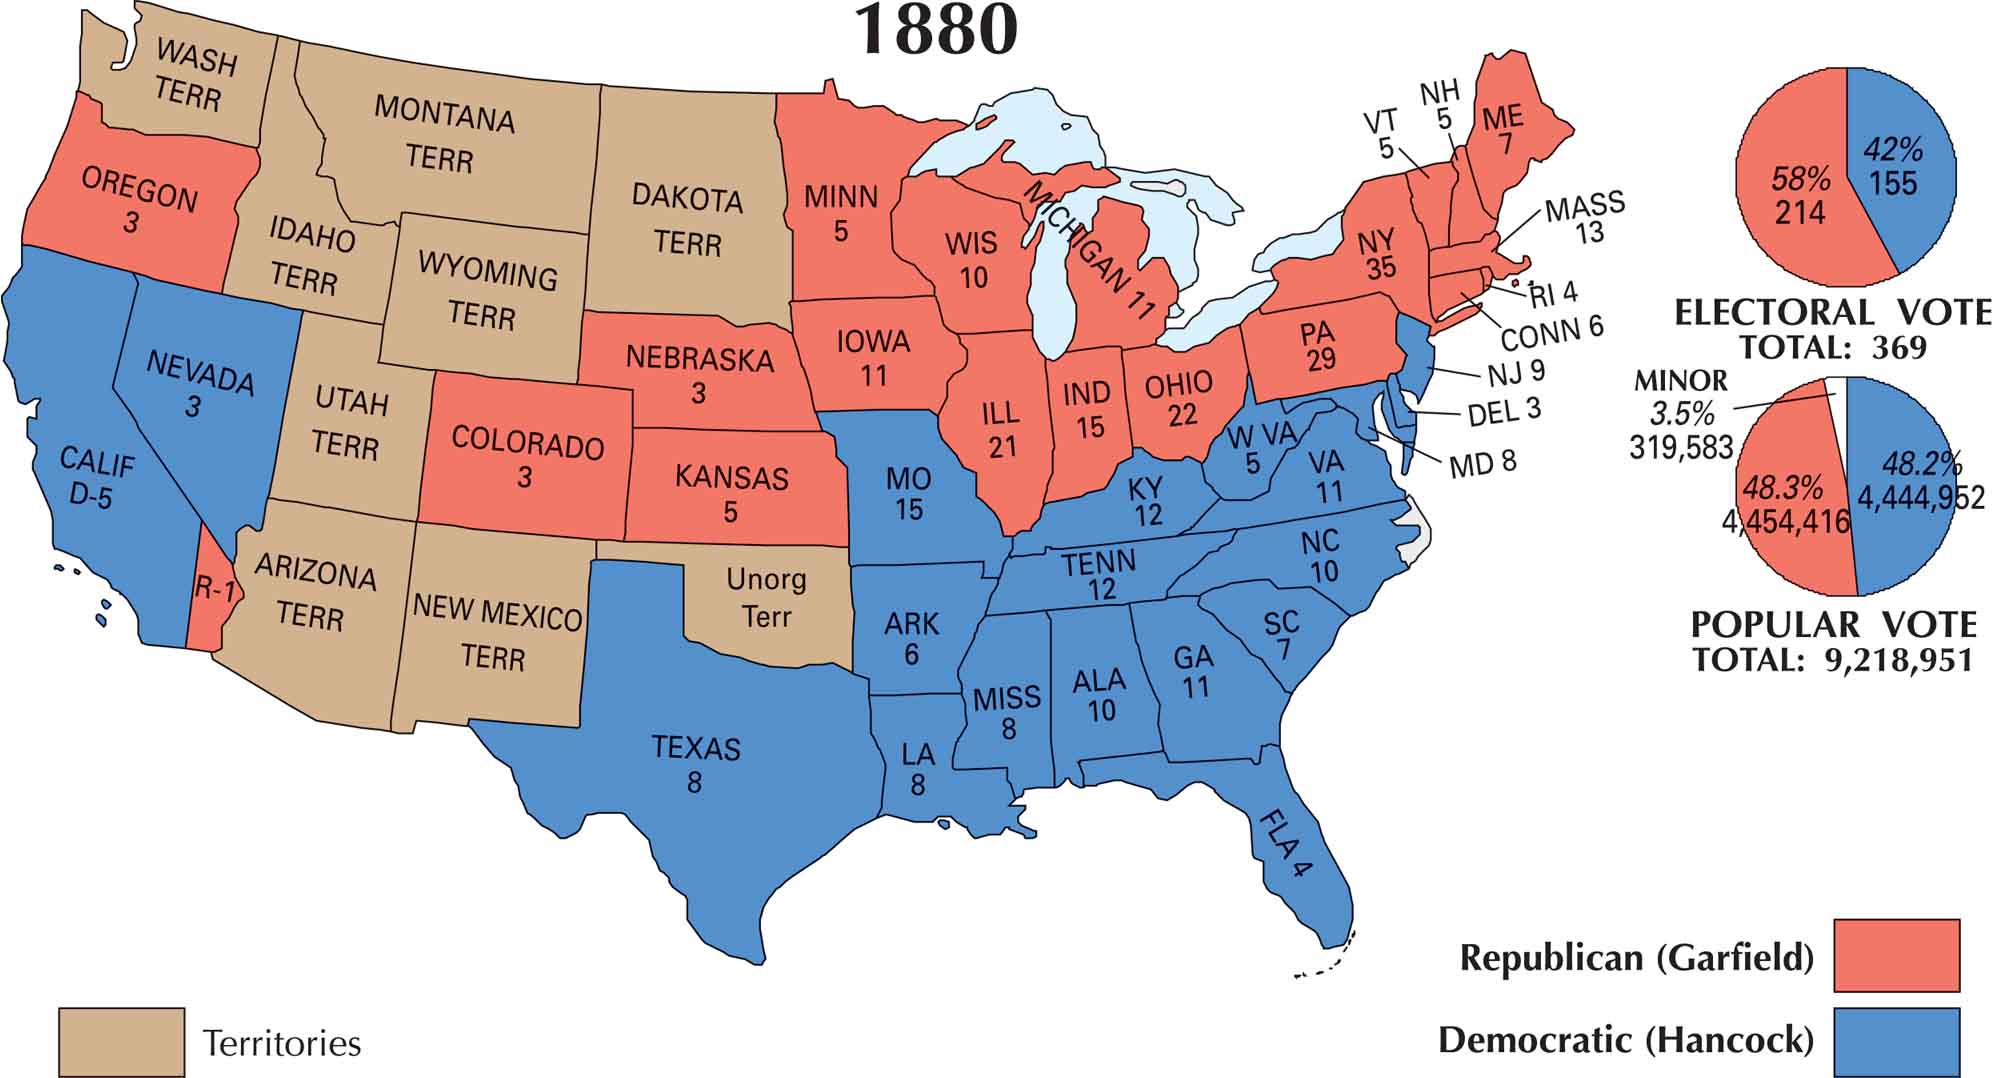
Our 1880 US election maps shows Republican James A. Garfield as the winner by one of the narrowest margins in history. He edged out Democrat Winfield Scott Hancock, winning the popular vote by less than a percent. On the map, the North and much of the Midwest went for Garfield. Meanwhile, the South stayed solidly Democratic.
Map Information
US Election Maps
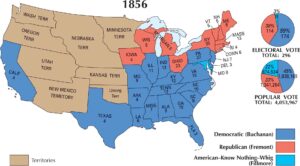
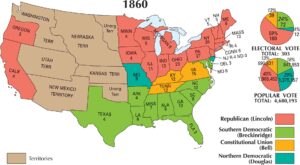
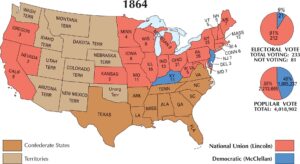
Click on a map below to check out the US election map and results.

On the Map
The 1880 election was one of the closest popular vote contests in history. James A. Garfield (Republican) defeated Winfield Scott Hancock (Democrat) by fewer than 10,000 popular votes, though he won a decisive majority in the Electoral College.
States and Electoral Votes
|
State |
Total Votes |
Garfield (R) |
Hancock (D) |
|
New York |
35 |
35 |
0 |
|
Pennsylvania |
29 |
29 |
0 |
|
Ohio |
22 |
22 |
0 |
|
Illinois |
21 |
21 |
0 |
|
Indiana |
15 |
15 |
0 |
|
Missouri |
15 |
0 |
15 |
|
Massachusetts |
13 |
13 |
0 |
|
Kentucky |
12 |
0 |
12 |
|
Tennessee |
12 |
0 |
12 |
|
Virginia |
11 |
0 |
11 |
|
Georgia |
11 |
0 |
11 |
|
Michigan |
11 |
11 |
0 |
|
Iowa |
11 |
11 |
0 |
|
North Carolina |
10 |
0 |
10 |
|
Wisconsin |
10 |
10 |
0 |
|
Alabama |
10 |
0 |
10 |
|
New Jersey |
9 |
0 |
9 |
|
Texas |
8 |
0 |
8 |
|
Maryland |
8 |
0 |
8 |
|
Mississippi |
8 |
0 |
8 |
|
Louisiana |
8 |
0 |
8 |
|
California |
6 |
1 |
5 |
|
South Carolina |
7 |
0 |
7 |
|
Maine |
7 |
7 |
0 |
|
Connecticut |
6 |
6 |
0 |
|
Arkansas |
6 |
0 |
6 |
|
West Virginia |
5 |
0 |
5 |
|
New Hampshire |
5 |
5 |
0 |
|
Vermont |
5 |
5 |
0 |
|
Minnesota |
5 |
5 |
0 |
|
Kansas |
5 |
5 |
0 |
|
Rhode Island |
4 |
4 |
0 |
|
Florida |
4 |
0 |
4 |
|
Nebraska |
3 |
3 |
0 |
|
Colorado |
3 |
3 |
0 |
|
Nevada |
3 |
0 |
3 |
|
Oregon |
3 |
3 |
0 |
|
Delaware |
3 |
0 |
3 |
Election Summary
- The Winner: James A. Garfield (Republican) secured 214 electoral votes (58%).
- The Challenger: Winfield Scott Hancock (Democrat) received 155 electoral votes (42%).
- Popular Vote: Totaled 9,218,951. The gap was exceptionally narrow: Garfield won 48.3% (4,454,416) to Hancock’s 48.2% (4,444,952).
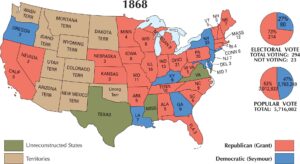
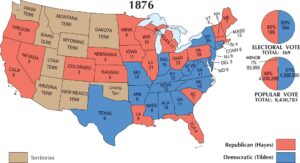
- The “Solid South”: Following the end of Reconstruction seen in the 1876 map, the 1880 map shows the Democrats carrying every single former Confederate state.
- Split Votes: California provided a rare split, with Garfield receiving 1 electoral vote and Hancock receiving 5.