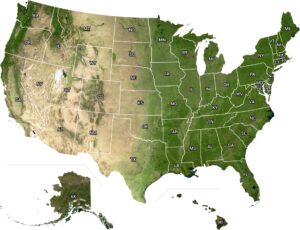
US Mean Annual Relative Humidity Map
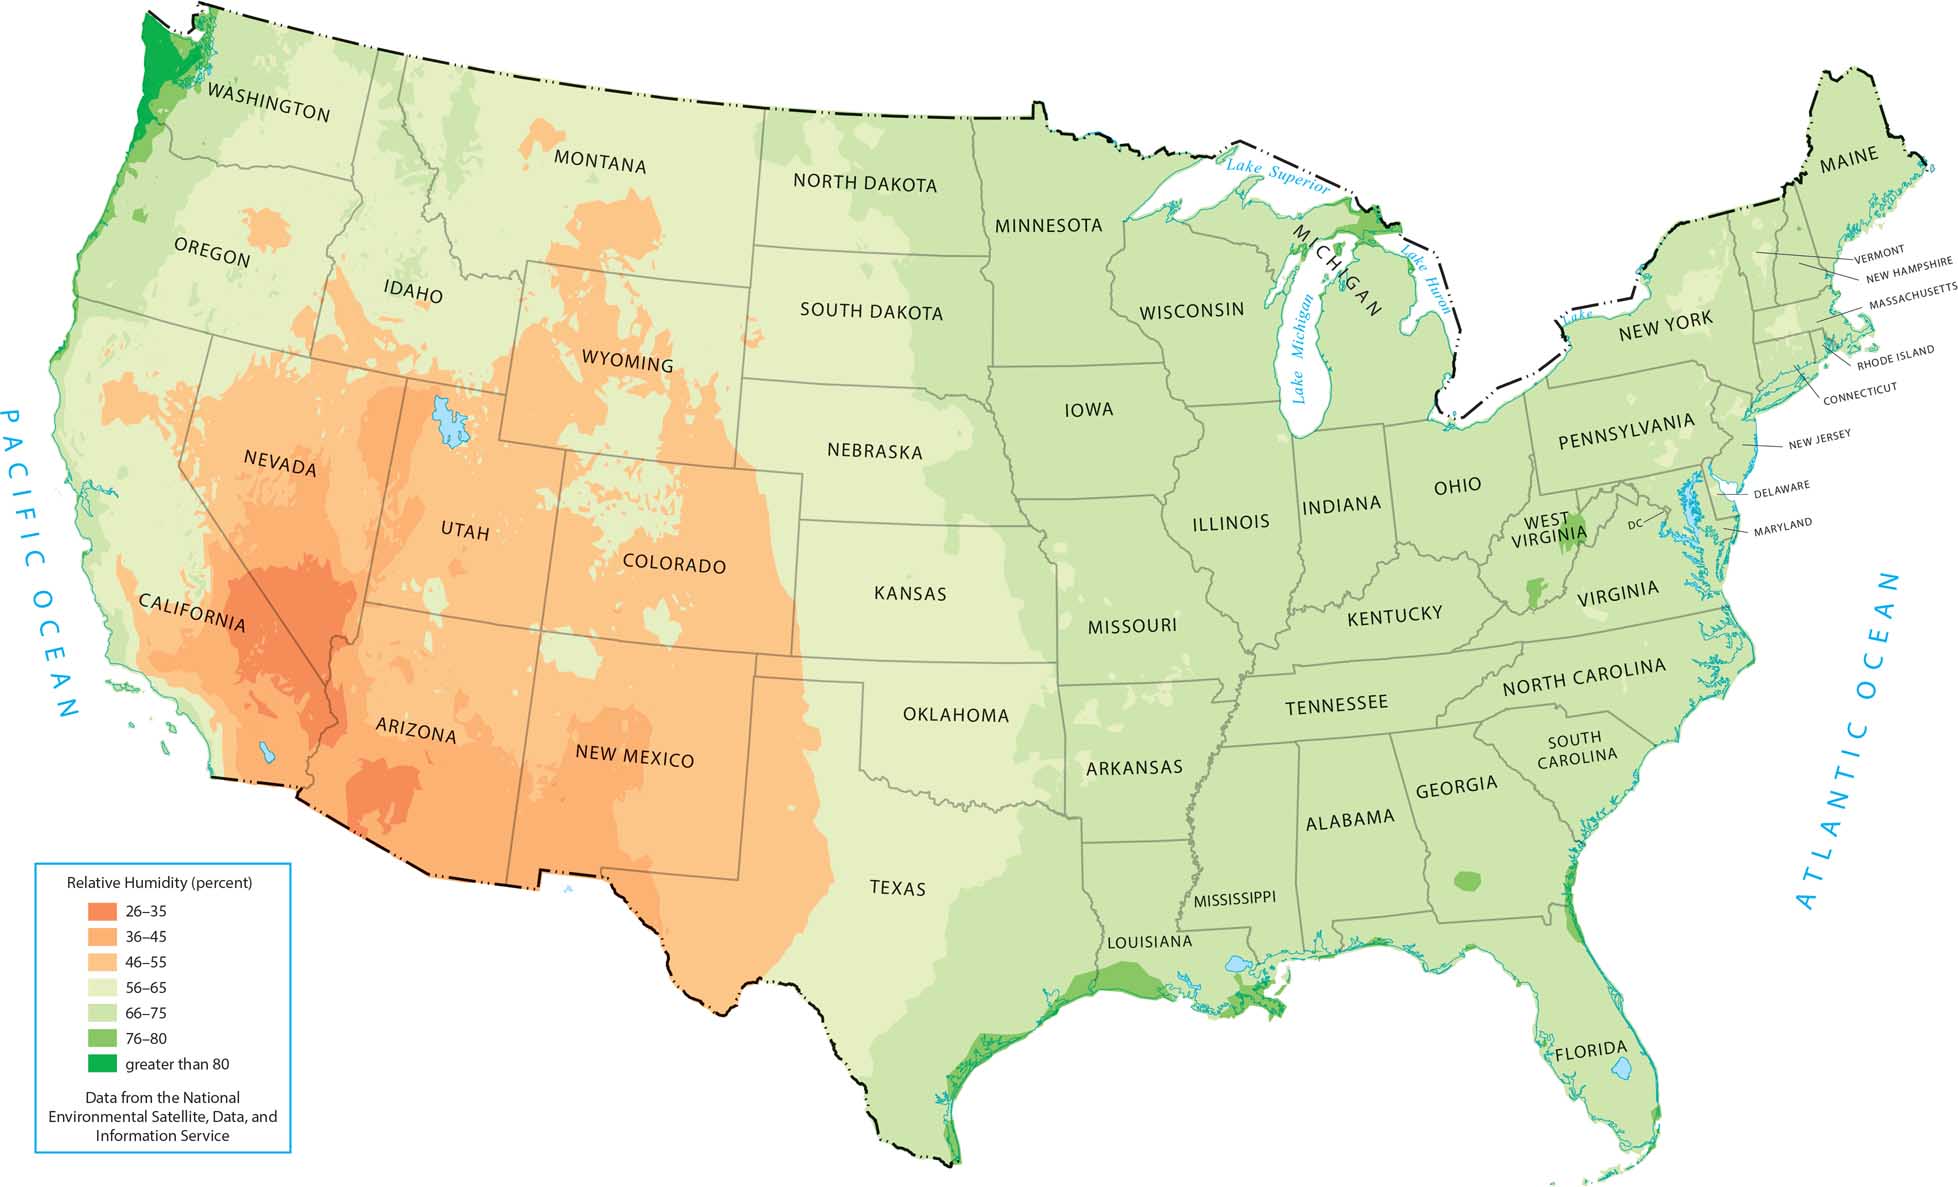
Humidity patterns follow air sources and land cover. Higher humidity appears in the Southeast and along coasts, while drier air dominates deserts and high plains. Our map shows how the United States gets progressively more humid as you move from the dry West to the moisture-rich East.
Map Information
Country Maps
Explore the geography that defines this nation.