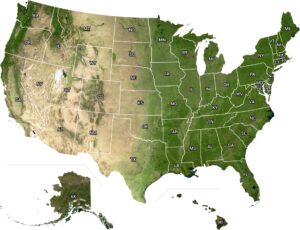
US Mean Annual Daily Minimum Temperature Map
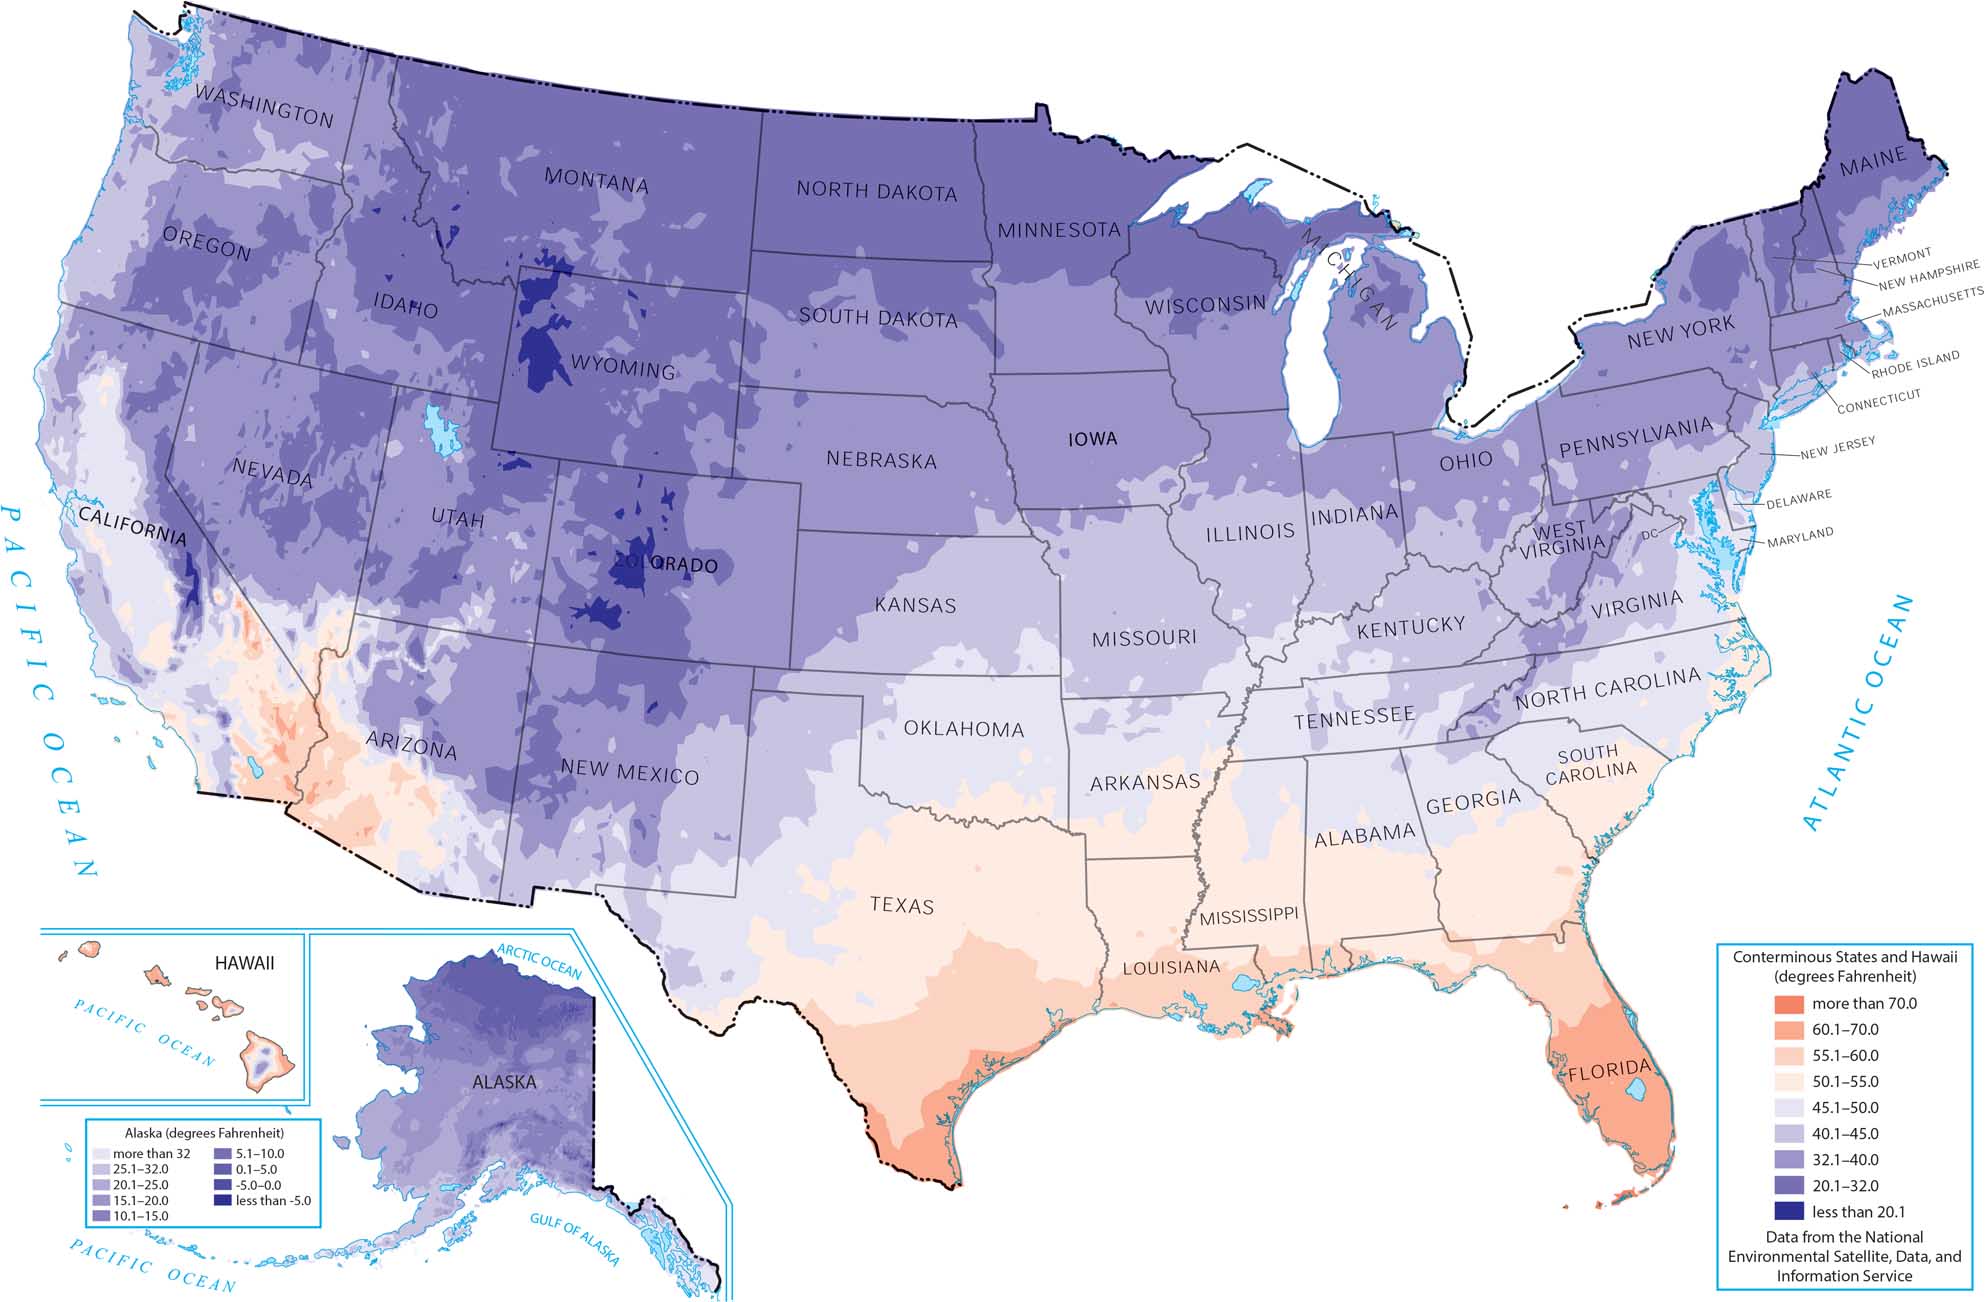
Our minimum temperature map reveals how northern states and high-elevation areas experience the coldest overnight lows throughout the year. Alaska obviously dominates the cold end while southern coastal areas barely see cold nights at all. It’s mostly elevation and distance from oceans that affect overnight cooling.
Map Information
Country Maps
Explore the geography that defines this nation.