Montana Population Map
Population density in Montana is extremely low statewide. Our map shows long distances between towns, which is where most people live.

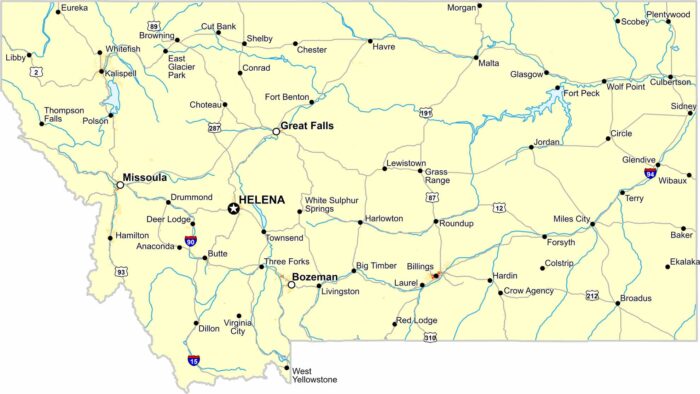
Population density in Montana is extremely low statewide. Our map shows long distances between towns, which is where most people live.
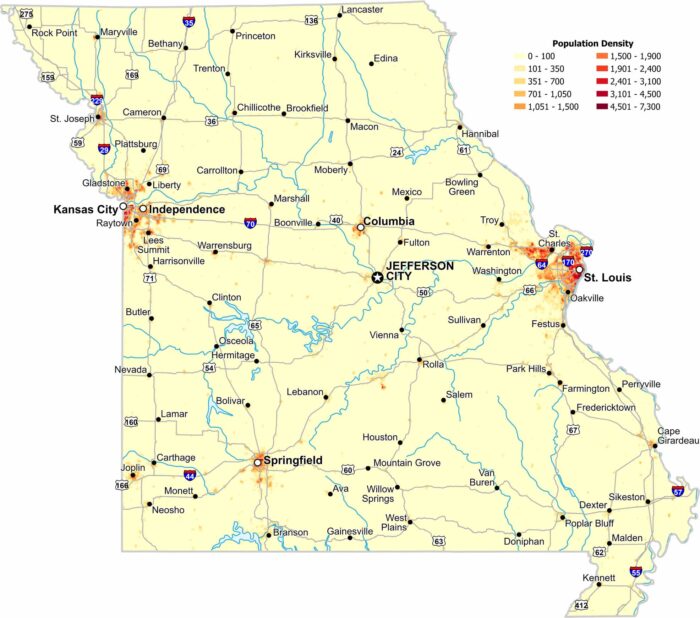
Population clusters around major metro areas like St. Louis and Kansas city. Central regions stay open with lower population density.
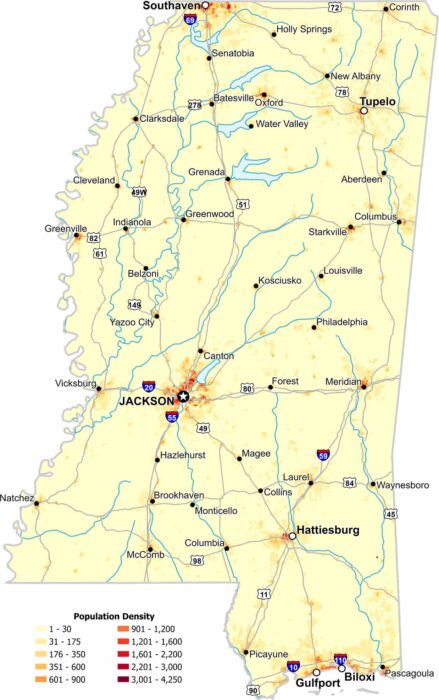
In Mississippi, population density increases near river corridors and major cities. Our map shows wide rural stretches with less population.
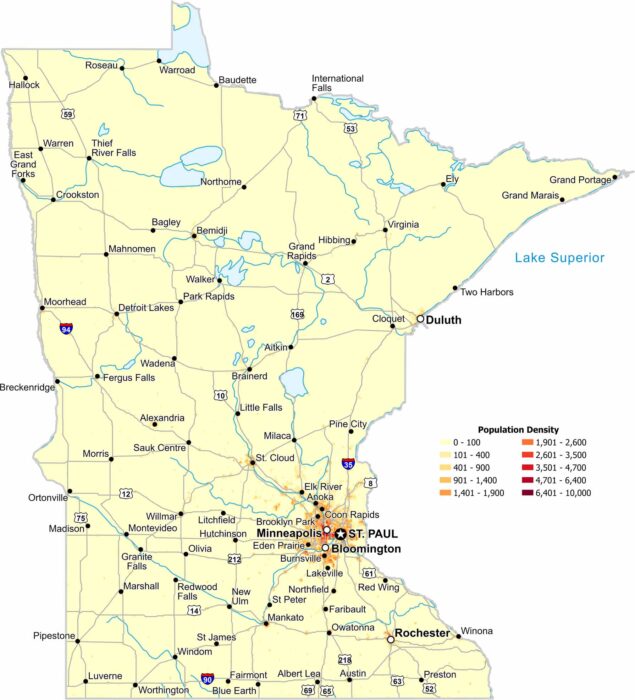
The Twin Cities dominate our population density map of Minnesota. But density fades outward such as in the sparse northern regions.
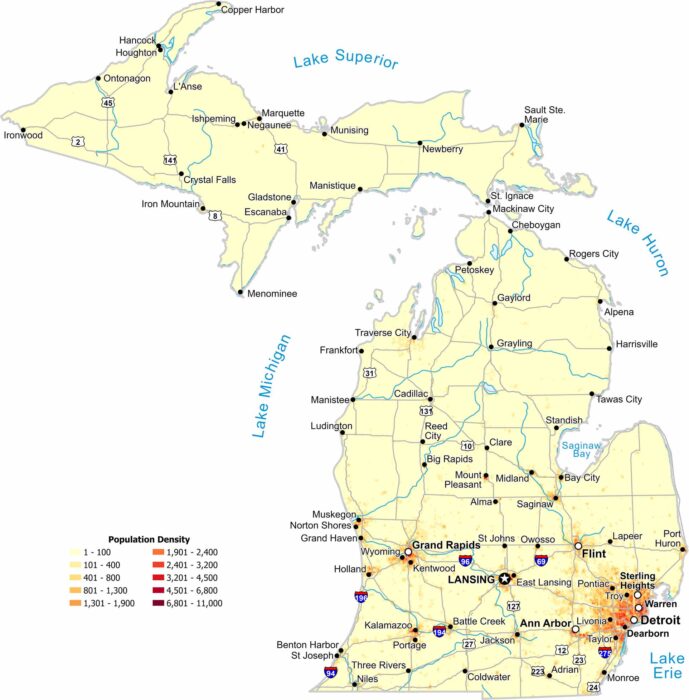
Our population density map of Michigan shows a sharp north–south contrast. Population clusters near Detroit and along lake shores.
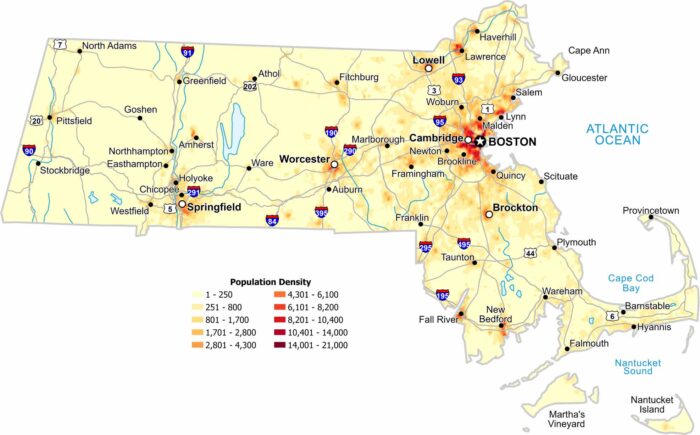
Eastern Massachusetts appears tightly packed on our population density map. Roads and cities overlap heavily on the map.
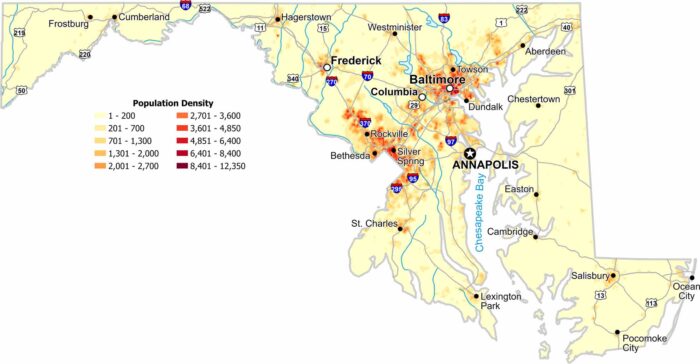
Population density peaks near major metro areas like Baltimore. Our Maryland population density map shows thinning population farther inland.
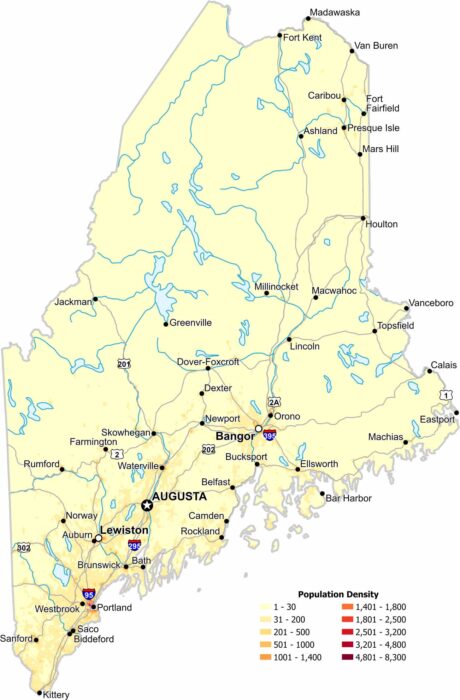
Southern Maine holds most of the population. Our population density map highlights density near the coast and highways.
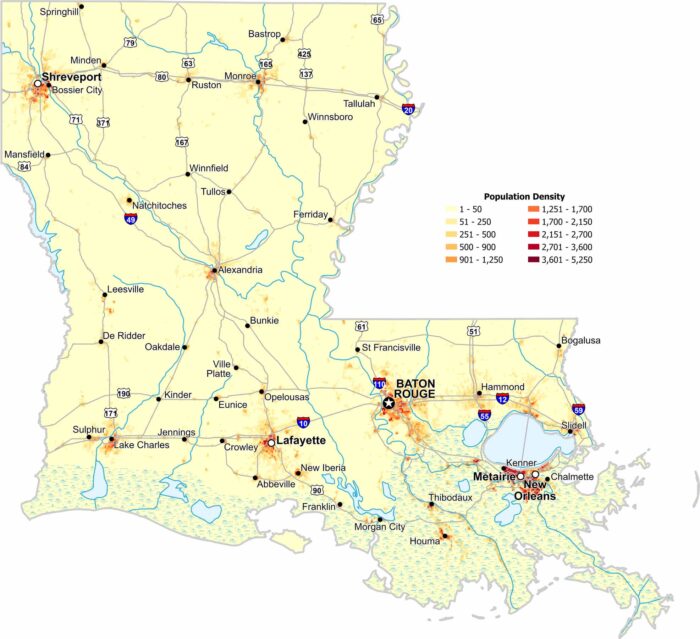
The Mississippi River corridor dominates population density in Louisiana. Major cities like New Orleans and Baton Rouge line this waterway.
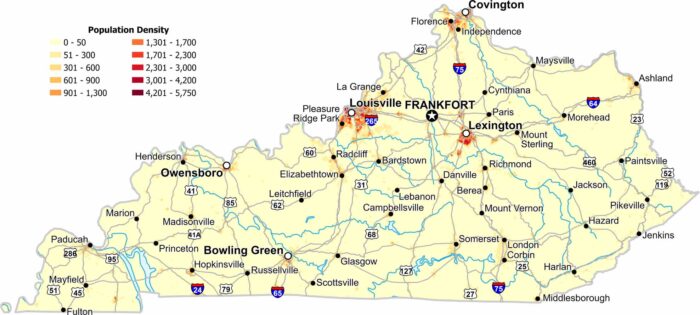
Our population density map of Kentucky shows Appalachian terrain limiting eastern growth. The northern and central areas appear denser.
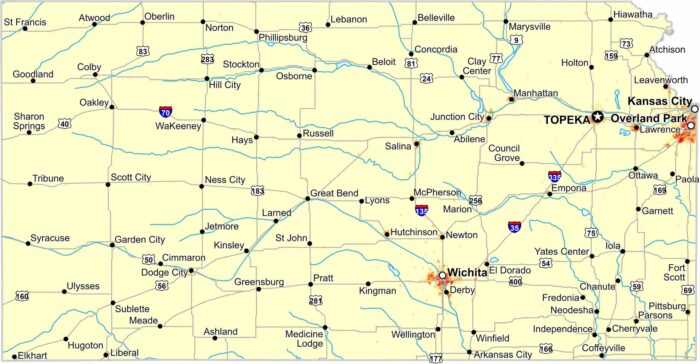
Check out our population density map of Kansas to see population thin across the plains. Eastern Kansas shows higher density than the west.
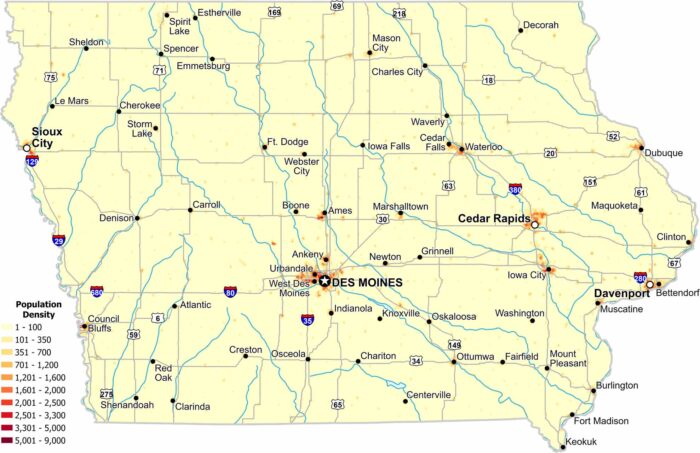
Population density remains moderate across much of Iowa. Des Moines, Davenport and Cedar Rapids have the highest population density.
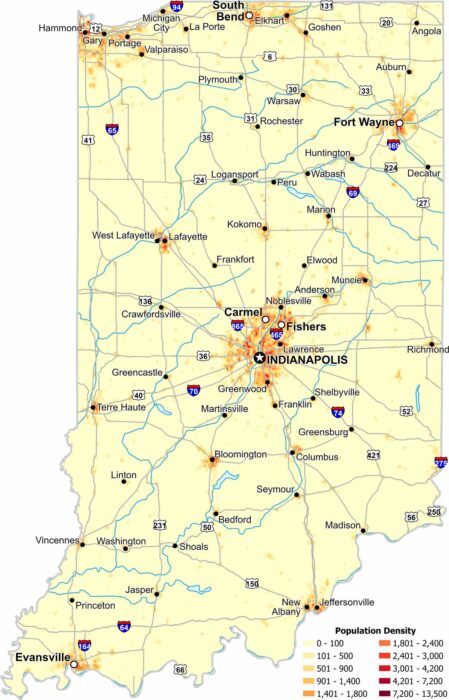
Our Indiana population density map shows urban centers with Indianapolis, Evansville and Fort Wayne as the main focal points.
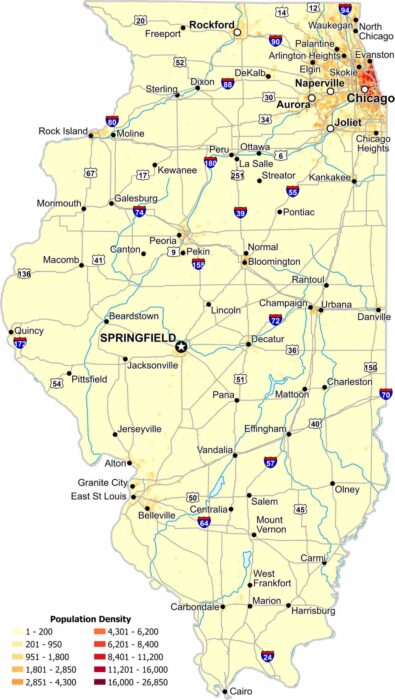
Northern Illinois stands out immediately on our Illinois population density map. You’ll see how Chicago dominates population density.
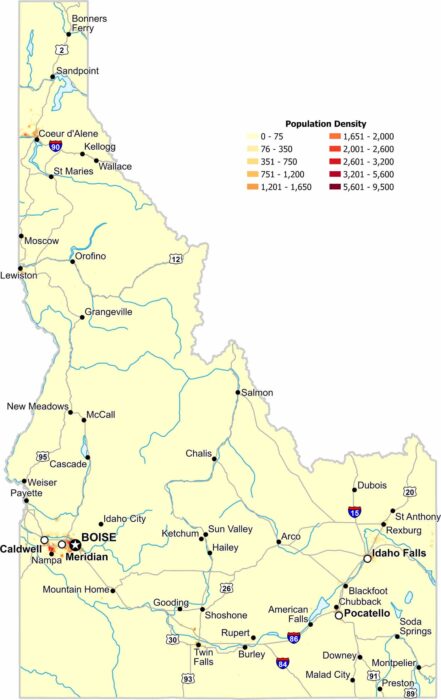
Most of Idaho remains lightly populated because its terrain limits widespread development. The only major density appears near Boise.