Louisiana Purchase of 1803 Map
Our map of the Louisiana Purchase of 1803 shows an enormous block of land that fills the center of the country.
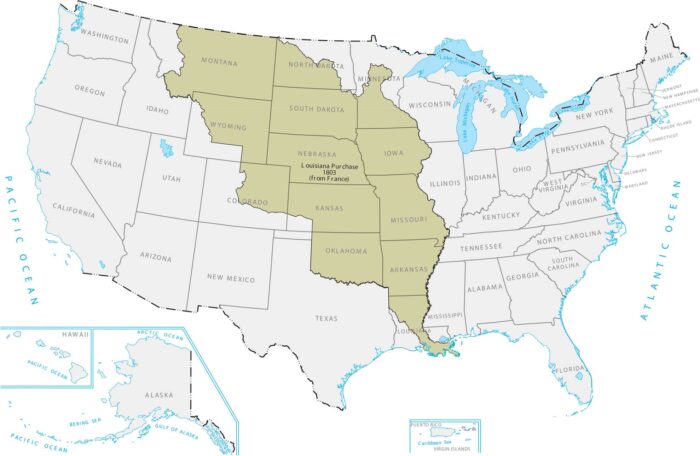
Our map of the Louisiana Purchase of 1803 shows an enormous block of land that fills the center of the country.
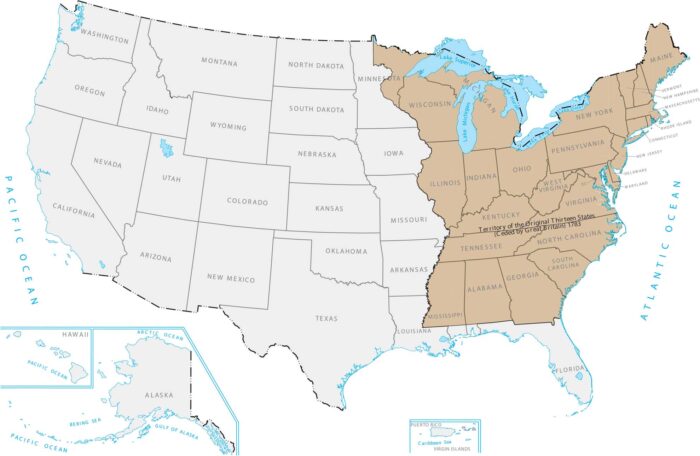
Our Territory of the Original Thirteen States map shows where America started. It was just a thin strip of colonies along the Atlantic Coast.
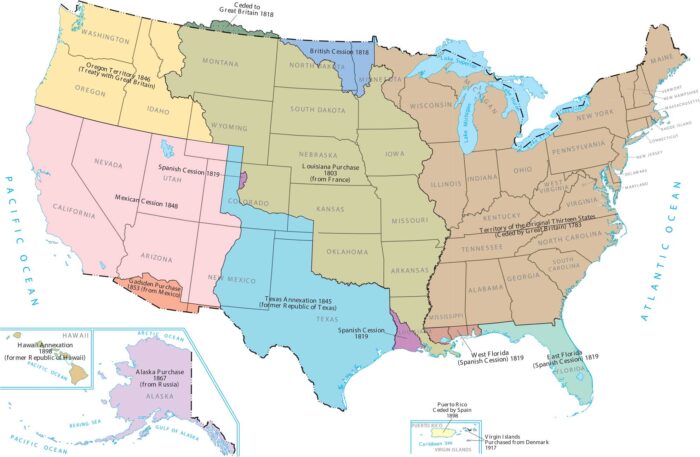
This map shows how America grew from the East Coast to the huge country it is today. Most of the expansion happened in the 1800s.
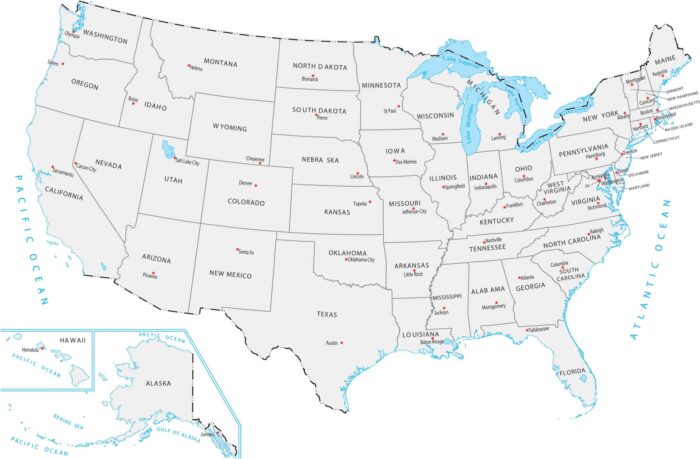
Our US state capital map highlights where political centers are across the country. States are shown with their capital cities.
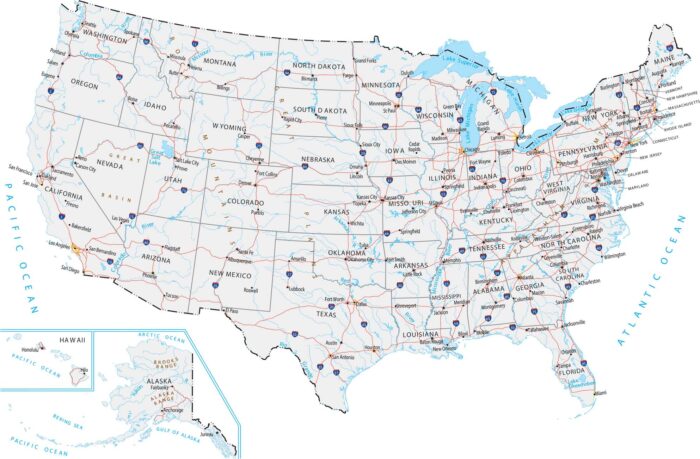
Our US road map combines highways and physical features. Interstates, cities, rivers, and mountain ranges are all visible together.
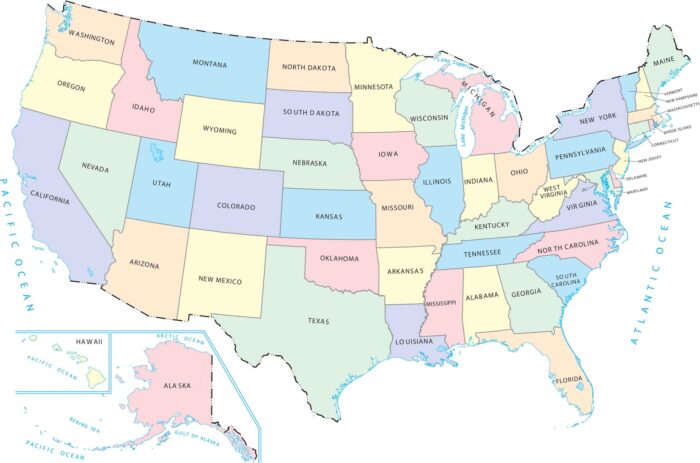
The United States looks very organized when you use soft, light colors. Our United States pastel map is designed to be easy on the eyes.
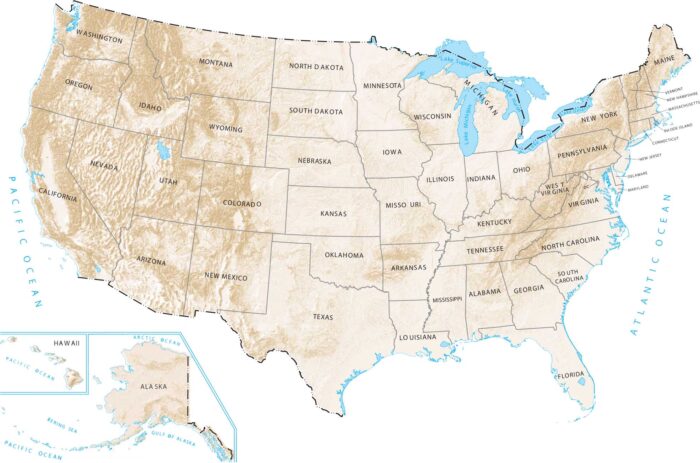
Our US hillshade map shows you exactly where the land rises and falls across the country. Mountain ranges, plateaus, and valleys stand out.
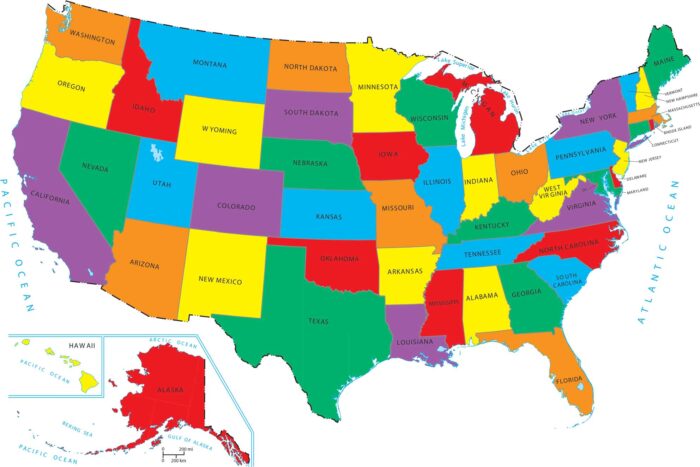
Our bright-colored map of the United State uses vivid, high-contrast colors. Each state stands out clearly from its neighbors.
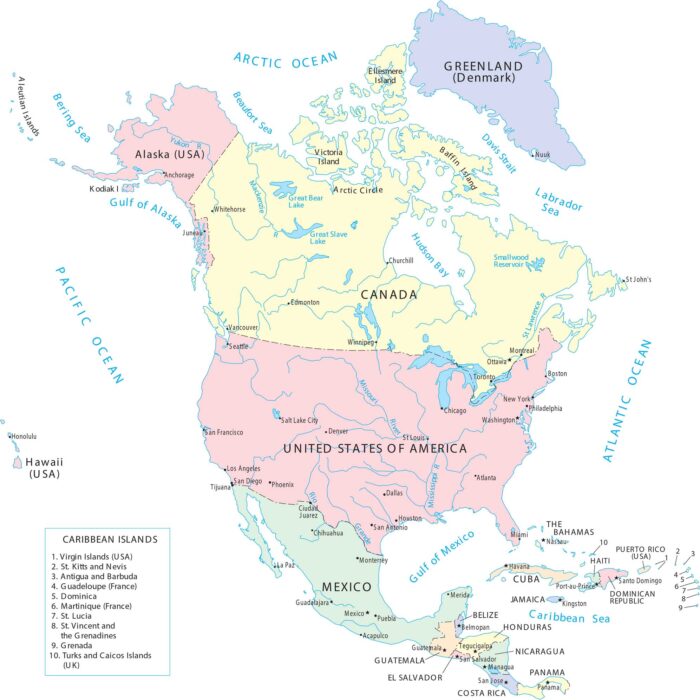
This map shows the United States in its wider continental context. It helps place the country within the larger geography of North America.
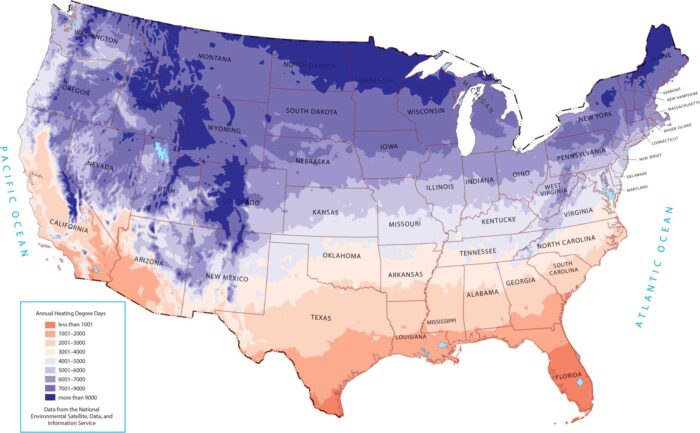
As shown on our map, heating demand increases moving north and into higher elevations. The deep South shows the exact opposite.
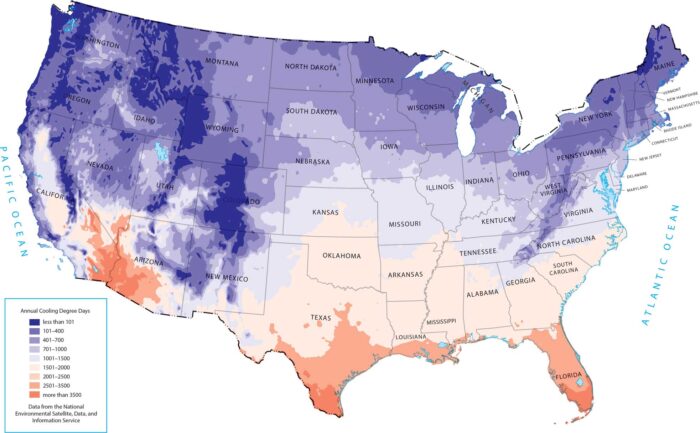
This map highlights where cooling demand is greatest. Southern states and desert regions stand out because of high temperatures.
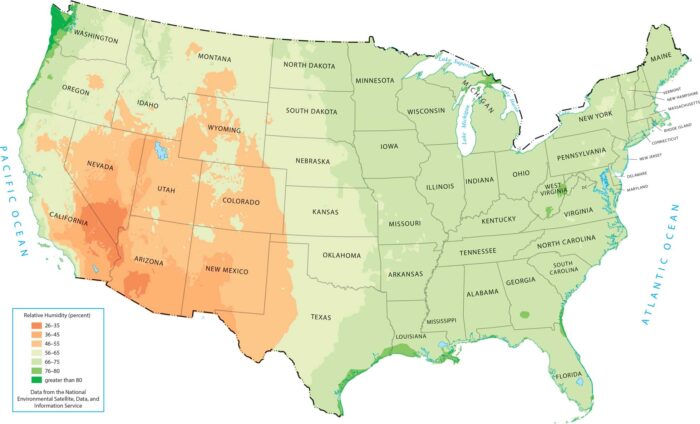
Our map shows how the United States gets progressively more humid as you move from the dry West to the moisture-rich East.
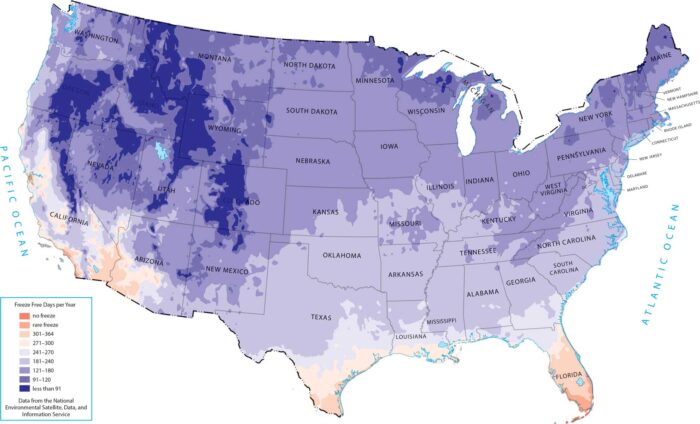
Our map reflects how latitude and ocean control growing seasons. The freeze-free period grows longer as you move south and toward the coasts.
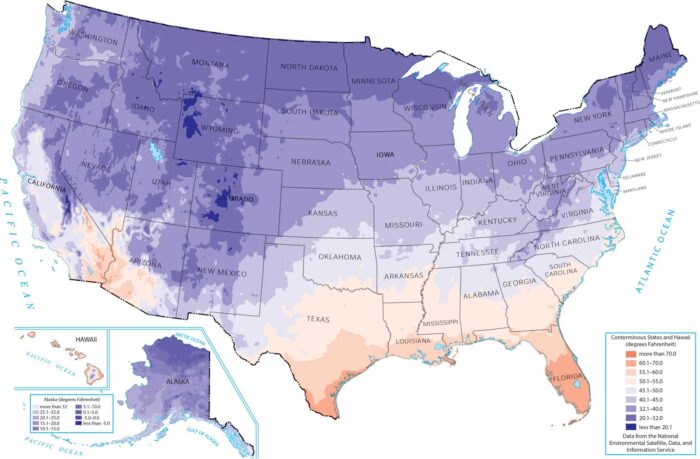
Our minimum temperature map reveals how northern states and high-elevation areas experience the coldest overnight lows throughout the year.
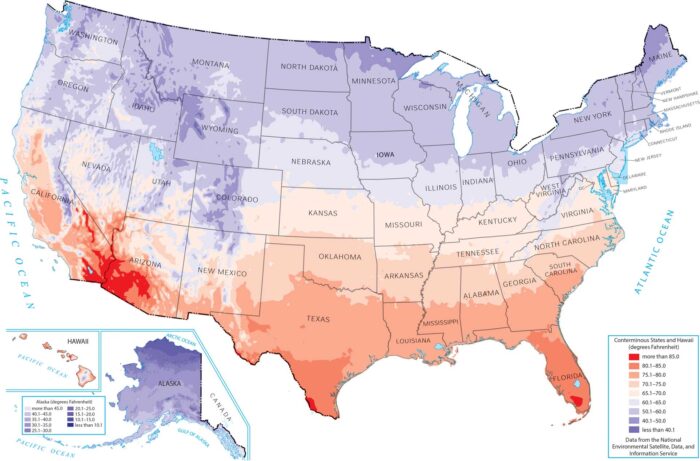
This map shows how maximum temperature varies across the country. It shows how latitude, elevation, and desert geography drive temperature.