US Election 2016 Map
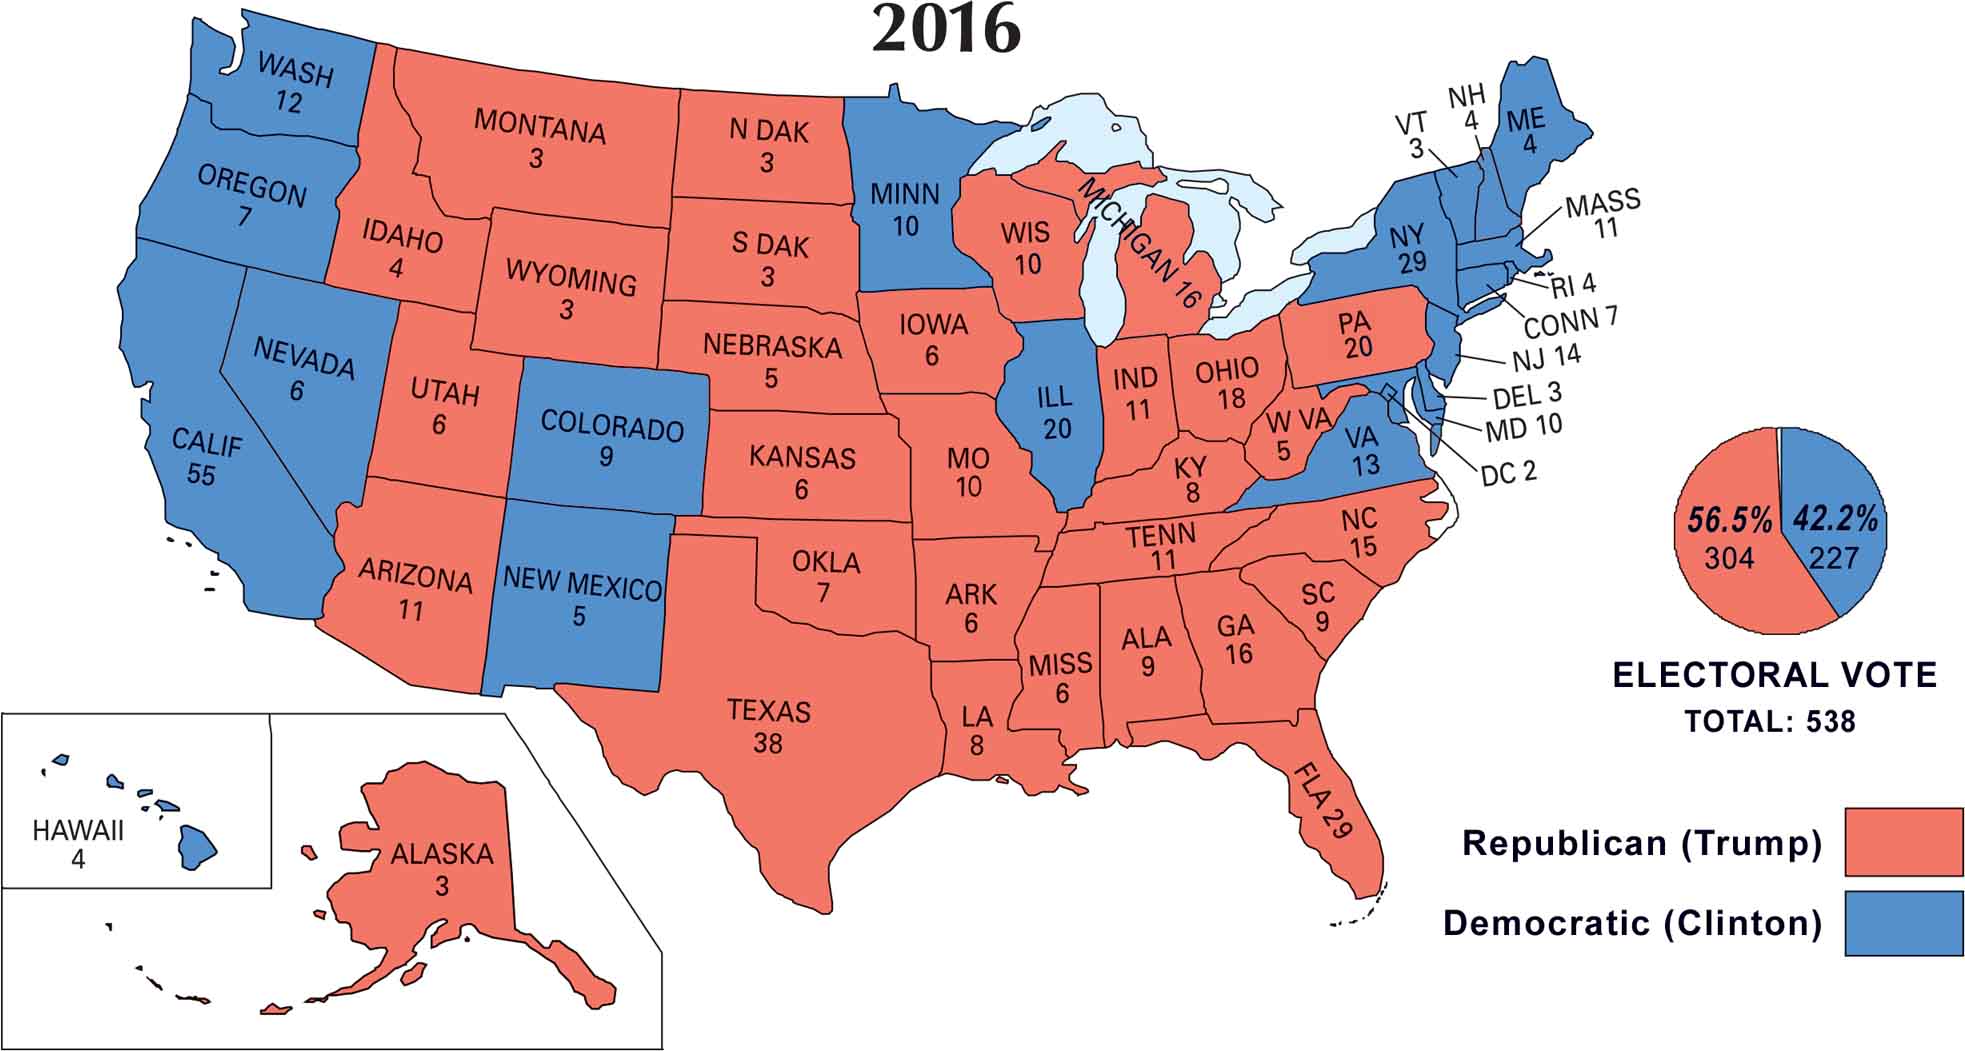
The 2016 U.S. election map flipped sharply red. Donald Trump pulled off a surprise win over Hillary Clinton, breaking through the “blue wall” of the Midwest. Trump carried much of the South, Midwest, and interior states.
Map Information
US Election Maps
Click on a map below to check out the US election map and results.


On the Map
Here is the breakdown for the 2016 Presidential Election.
States and Electoral Votes
|
State Name |
Total Votes |
Donald Trump (R) |
Hillary Clinton (D) |
|
California |
55 |
0 |
55 |
|
Texas |
38 |
36* |
0 |
|
Florida |
29 |
29 |
0 |
|
New York |
29 |
0 |
29 |
|
Illinois |
20 |
0 |
20 |
|
Pennsylvania |
20 |
20 |
0 |
|
Ohio |
18 |
18 |
0 |
|
Georgia |
16 |
16 |
0 |
|
Michigan |
16 |
16 |
0 |
|
North Carolina |
15 |
15 |
0 |
|
New Jersey |
14 |
0 |
14 |
|
Virginia |
13 |
0 |
13 |
|
Washington |
12 |
0 |
8* |
|
Arizona |
11 |
11 |
0 |
|
Indiana |
11 |
11 |
0 |
|
Massachusetts |
11 |
0 |
11 |
|
Tennessee |
11 |
11 |
0 |
|
Maryland |
10 |
0 |
10 |
|
Minnesota |
10 |
0 |
10 |
|
Missouri |
10 |
10 |
0 |
|
Wisconsin |
10 |
10 |
0 |
|
Alabama |
9 |
9 |
0 |
|
Colorado |
9 |
0 |
9 |
|
South Carolina |
9 |
9 |
0 |
|
Kentucky |
8 |
8 |
0 |
|
Louisiana |
8 |
8 |
0 |
|
Connecticut |
7 |
0 |
7 |
|
Oklahoma |
7 |
7 |
0 |
|
Oregon |
7 |
0 |
7 |
|
Arkansas |
6 |
6 |
0 |
|
Iowa |
6 |
6 |
0 |
|
Kansas |
6 |
6 |
0 |
|
Mississippi |
6 |
6 |
0 |
|
Nevada |
6 |
0 |
6 |
|
Utah |
6 |
6 |
0 |
|
Nebraska |
5 |
5 |
0 |
|
New Mexico |
5 |
0 |
5 |
|
West Virginia |
5 |
5 |
0 |
|
Hawaii |
4 |
0 |
3* |
|
Idaho |
4 |
4 |
0 |
|
Maine |
4 |
1 |
3 |
|
New Hampshire |
4 |
0 |
4 |
|
Rhode Island |
4 |
0 |
4 |
|
Alaska |
3 |
3 |
0 |
|
Delaware |
3 |
0 |
3 |
|
D.C. |
3 |
0 |
3 |
|
Montana |
3 |
3 |
0 |
|
North Dakota |
3 |
3 |
0 |
|
South Dakota |
3 |
3 |
0 |
|
Vermont |
3 |
0 |
3 |
|
Wyoming |
3 |
3 |
0 |
Election Summary
- The Winner: Donald Trump (Republican) won the presidency with 304 electoral votes (56.5% of the total).
- The Runner-up: Hillary Clinton (Democrat) received 227 electoral votes (42.2% of the total).
- The “Rust Belt” Breach: The defining feature of this map is the Republican flip of the formerly “Blue Wall” states: Pennsylvania, Michigan, and Wisconsin.
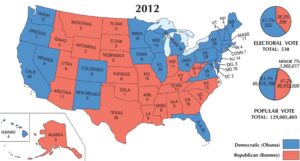
- Midwest Shift: Iowa and Ohio, which both voted for Obama in 2012, shifted significantly to the Republican column.
- Sun Belt Defense: Despite a targeted Democratic push, Republicans held onto key states like Florida, North Carolina, and Arizona.