US Election 2012 Map
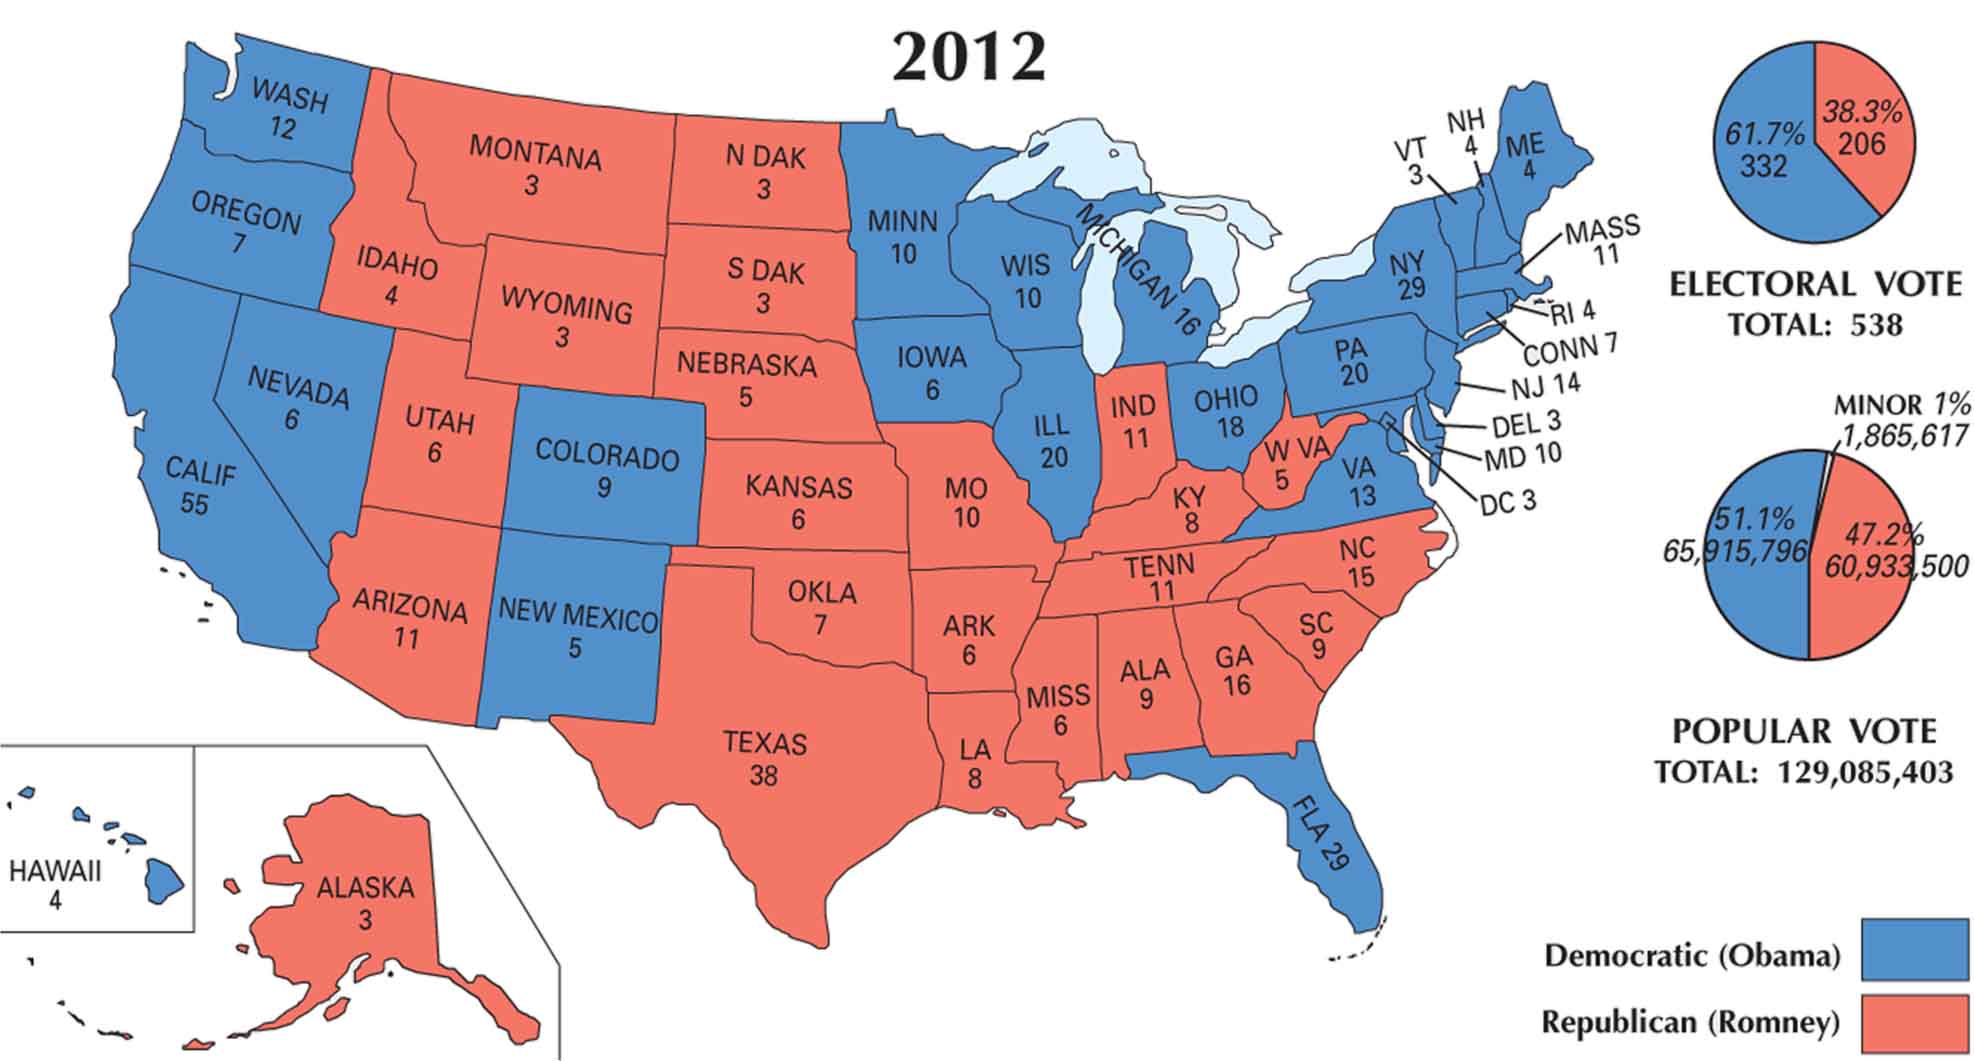
Blue holds strong on our 2012 U.S. election map as Barack Obama won re-election over Mitt Romney. While urban and coastal America leaned toward blue, rural and Southern regions remained red. It was a close election but Obama’s strength in swing states like Ohio and Florida sealed the deal.
Map Information
US Election Maps
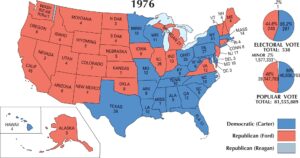
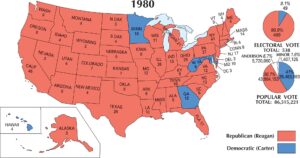
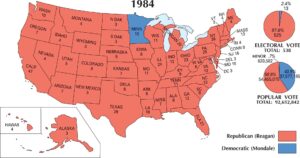
Click on a map below to check out the US election map and results.


On the Map
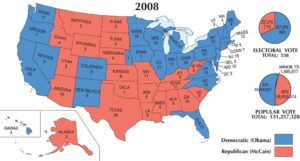
The 2012 Presidential Election saw incumbent Barack Obama (Democrat) win a second term by defeating Mitt Romney (Republican). While the map was similar to 2008, the Republican party reclaimed two key states, Indiana and North Carolina.
States and Electoral Votes
|
State Name |
Total Votes |
Barack Obama (D) |
Mitt Romney (R) |
|
California |
55 |
55 |
0 |
|
Texas |
38 |
0 |
38 |
|
Florida |
29 |
29 |
0 |
|
New York |
29 |
29 |
0 |
|
Illinois |
20 |
20 |
0 |
|
Pennsylvania |
20 |
20 |
0 |
|
Ohio |
18 |
18 |
0 |
|
Georgia |
16 |
0 |
16 |
|
Michigan |
16 |
16 |
0 |
|
North Carolina |
15 |
0 |
15 |
|
New Jersey |
14 |
14 |
0 |
|
Virginia |
13 |
13 |
0 |
|
Washington |
12 |
12 |
0 |
|
Arizona |
11 |
0 |
11 |
|
Indiana |
11 |
0 |
11 |
|
Massachusetts |
11 |
11 |
0 |
|
Tennessee |
11 |
0 |
11 |
|
Maryland |
10 |
10 |
0 |
|
Minnesota |
10 |
10 |
0 |
|
Missouri |
10 |
0 |
10 |
|
Wisconsin |
10 |
10 |
0 |
|
Alabama |
9 |
0 |
9 |
|
Colorado |
9 |
9 |
0 |
|
South Carolina |
9 |
0 |
9 |
|
Kentucky |
8 |
0 |
8 |
|
Louisiana |
8 |
0 |
8 |
|
Connecticut |
7 |
7 |
0 |
|
Oklahoma |
7 |
0 |
7 |
|
Oregon |
7 |
7 |
0 |
|
Arkansas |
6 |
0 |
6 |
|
Iowa |
6 |
6 |
0 |
|
Kansas |
6 |
0 |
6 |
|
Mississippi |
6 |
0 |
6 |
|
Nevada |
6 |
6 |
0 |
|
Utah |
6 |
0 |
6 |
|
Nebraska |
5 |
0 |
5 |
|
New Mexico |
5 |
5 |
0 |
|
West Virginia |
5 |
0 |
5 |
|
Hawaii |
4 |
4 |
0 |
|
Idaho |
4 |
0 |
4 |
|
Maine |
4 |
4 |
0 |
|
New Hampshire |
4 |
4 |
0 |
|
Rhode Island |
4 |
4 |
0 |
|
Alaska |
3 |
0 |
3 |
|
Delaware |
3 |
3 |
0 |
|
D.C. |
3 |
3 |
0 |
|
Montana |
3 |
0 |
3 |
|
North Dakota |
3 |
0 |
3 |
|
South Dakota |
3 |
0 |
3 |
|
Vermont |
3 |
3 |
0 |
|
Wyoming |
3 |
0 |
3 |
Election Summary
- The Winner: Barack Obama (Democrat) secured 332 electoral votes (61.7%).
- The Challenger: Mitt Romney (Republican) received 206 electoral votes (38.3%).
- Popular Vote: Obama won 51.1% (65,915,796 votes) to Romney’s 47.2% (60,933,500 votes).
- Blue Wall Retention: Obama successfully held on to nearly all the “Blue Wall” states in the Rust Belt and Northeast, including Pennsylvania, Michigan, and Wisconsin.
- Reversal in the Heartland: After flipping Indiana in 2008, the state returned to the Republican column in 2012 with a significant margin for Romney.
- Key Battlegrounds: Obama’s victory was cemented by winning nearly all the major swing states, including Ohio, Florida, Virginia, and Colorado.