US Election 2008 Map
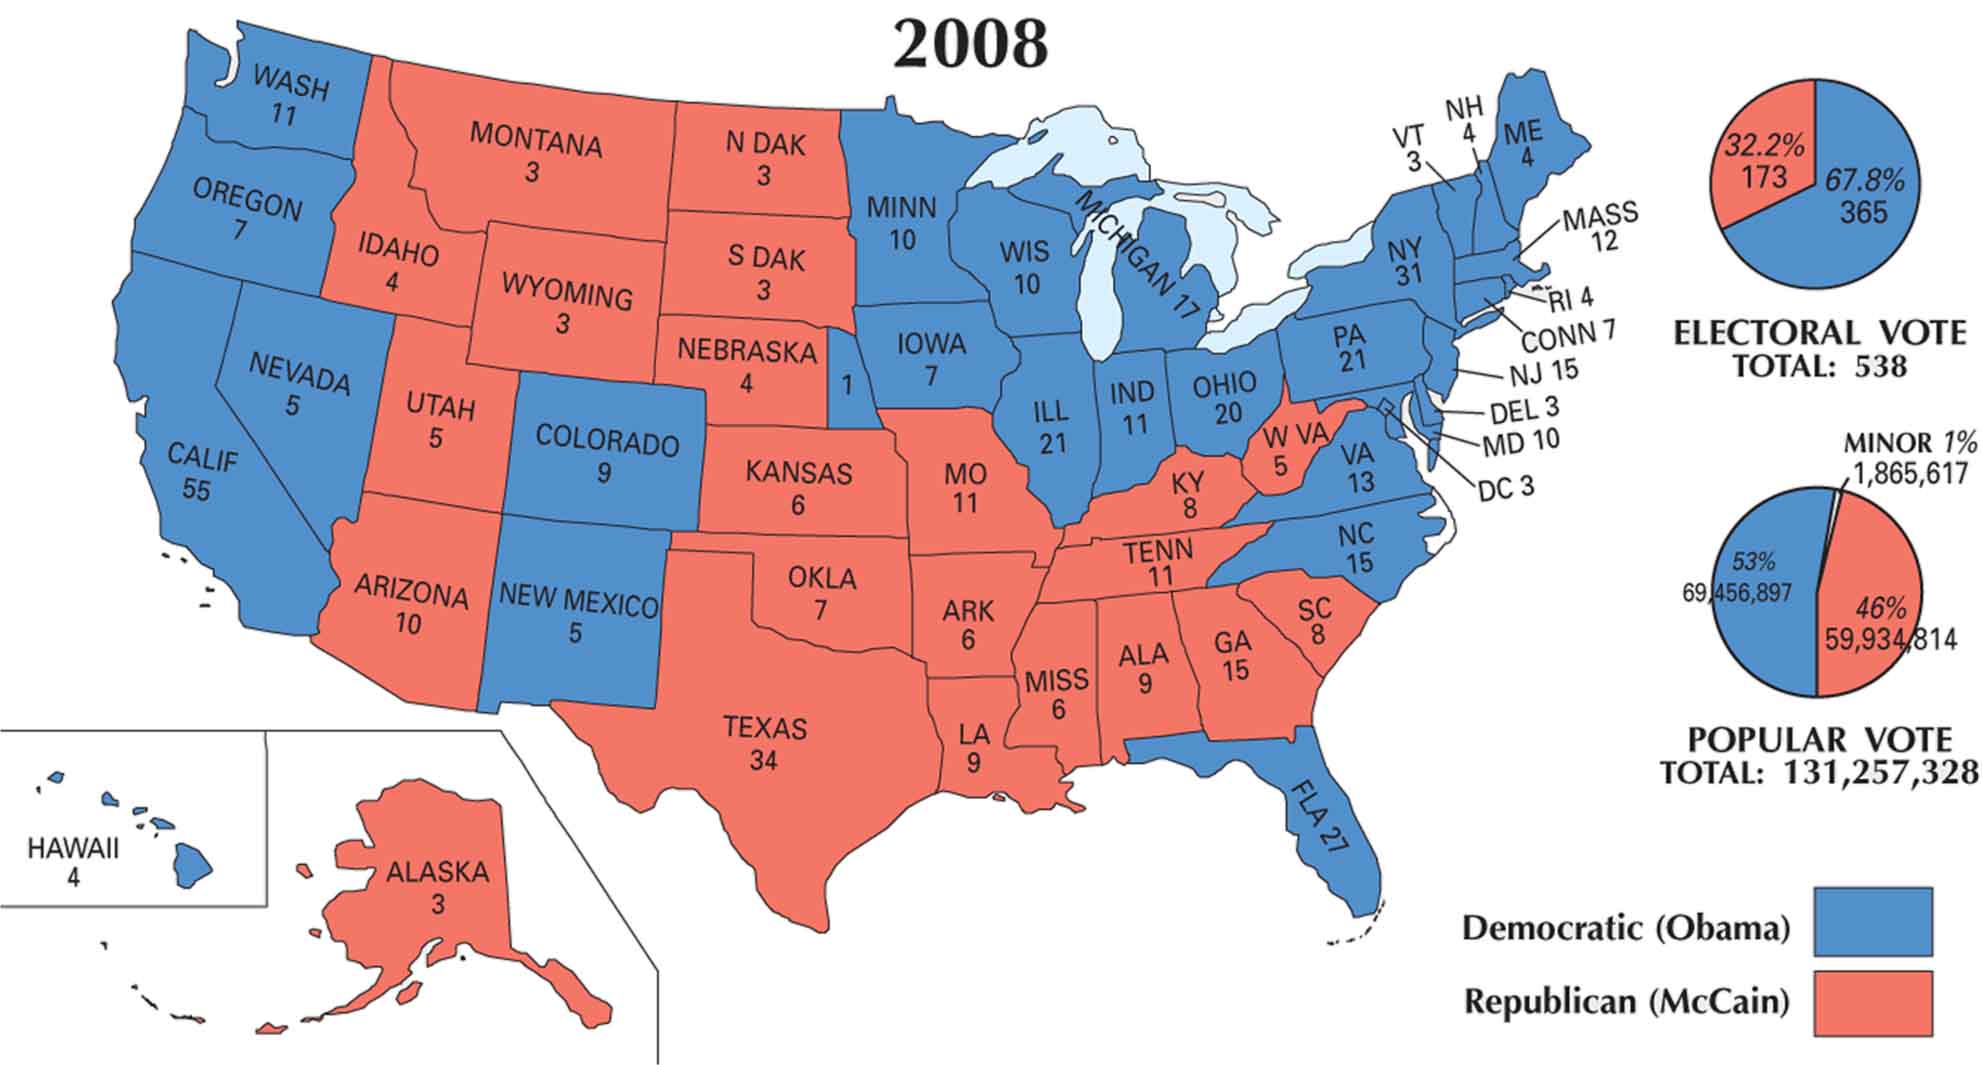
Bright blue spreads across the 2008 map as Barack Obama wins the presidency. He carried much of the Midwest, Northeast, and West Coast, flipping several key states that had voted Republican for years. Red remains across the South and parts of the Plains. The map marks a historic shift and the election of the nation’s first Black president.
Map Information
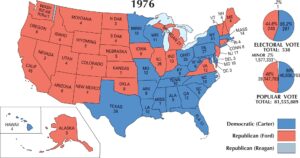
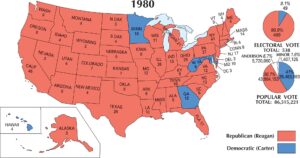
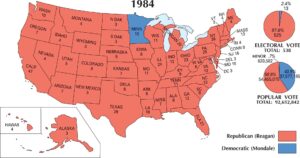
US Election Maps
Click on a map below to check out the US election map and results.


On the Map
The 2008 U.S. Presidential Election resulted in a historic victory for Democrat Barack Obama, who became the first African American president. Amidst an economic crisis, Obama flipped several key Republican-leaning states and secured a commanding electoral majority over Republican John McCain.
States and Electoral Votes
|
State Name |
Total Votes |
Democratic Votes |
Republican Votes |
|
California |
55 |
55 |
0 |
|
Texas |
34 |
0 |
34 |
|
New York |
31 |
31 |
0 |
|
Florida |
27 |
27 |
0 |
|
Illinois |
21 |
21 |
0 |
|
Pennsylvania |
21 |
21 |
0 |
|
Ohio |
20 |
20 |
0 |
|
Michigan |
17 |
17 |
0 |
|
Georgia |
15 |
0 |
15 |
|
New Jersey |
15 |
15 |
0 |
|
North Carolina |
15 |
15 |
0 |
|
Virginia |
13 |
13 |
0 |
|
Massachusetts |
12 |
12 |
0 |
|
Indiana |
11 |
11 |
0 |
|
Missouri |
11 |
0 |
11 |
|
Tennessee |
11 |
0 |
11 |
|
Washington |
11 |
11 |
0 |
|
Arizona |
10 |
0 |
10 |
|
Maryland |
10 |
10 |
0 |
|
Minnesota |
10 |
10 |
0 |
|
Wisconsin |
10 |
10 |
0 |
|
Alabama |
9 |
0 |
9 |
|
Colorado |
9 |
9 |
0 |
|
Louisiana |
9 |
0 |
9 |
|
Kentucky |
8 |
0 |
8 |
|
South Carolina |
8 |
0 |
8 |
|
Connecticut |
7 |
7 |
0 |
|
Iowa |
7 |
7 |
0 |
|
Oklahoma |
7 |
0 |
7 |
|
Oregon |
7 |
7 |
0 |
|
Arkansas |
6 |
0 |
6 |
|
Kansas |
6 |
0 |
6 |
|
Mississippi |
6 |
0 |
6 |
|
Nebraska |
5 |
1* |
4 |
|
Nevada |
5 |
5 |
0 |
|
New Mexico |
5 |
5 |
0 |
|
Utah |
5 |
0 |
5 |
|
West Virginia |
5 |
0 |
5 |
|
Hawaii |
4 |
4 |
0 |
|
Idaho |
4 |
0 |
4 |
|
Maine |
4 |
4 |
0 |
|
New Hampshire |
4 |
4 |
0 |
|
Rhode Island |
4 |
4 |
0 |
|
Alaska |
3 |
0 |
3 |
|
Delaware |
3 |
3 |
0 |
|
Dist. of Columbia |
3 |
3 |
0 |
|
Montana |
3 |
0 |
3 |
|
North Dakota |
3 |
0 |
3 |
|
South Dakota |
3 |
0 |
3 |
|
Vermont |
3 |
3 |
0 |
|
Wyoming |
3 |
0 |
3 |
Election Summary
- The Winner: Barack Obama (Democrat) secured 365 electoral votes (67.8%).
- The Challenger: John McCain (Republican) received 173 electoral votes (32.2%).
- Popular Vote: Obama won 52.9% (69,498,516 votes) to McCain’s 45.7% (59,948,323 votes).
- Turnout: Voter turnout was exceptionally high at 61.6%, the highest since 1968.
- Historical Shifts: Obama flipped nine states that had voted for George W. Bush in 2004: Colorado, Florida, Indiana, Iowa, Nevada, New Mexico, North Carolina, Ohio, and Virginia.
- Nebraska’s Split: For the first time since the state adopted its proportional allocation system, Nebraska split its electoral votes, with Obama winning the 2nd Congressional District (Omaha).