US Election 1948 Map
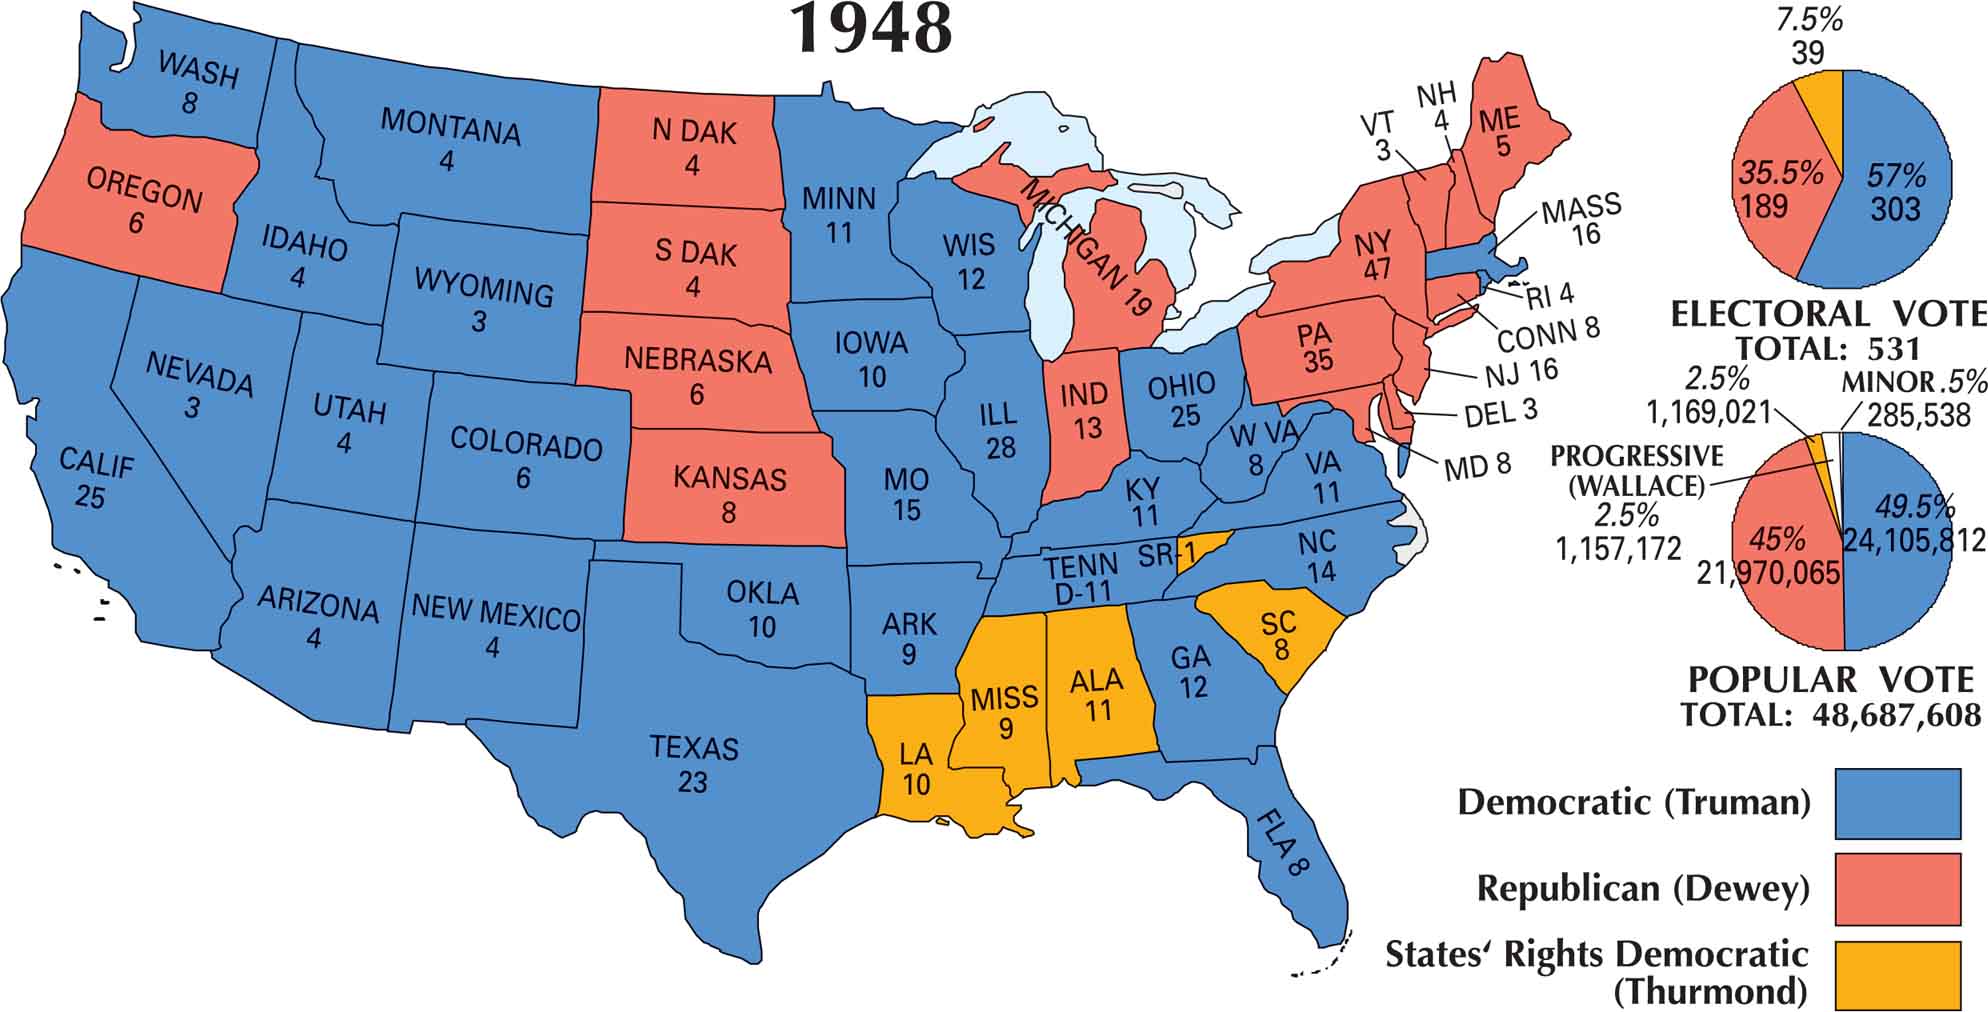
Nobody saw this one coming. The 1948 US election map burst blue after nearly everyone predicted a Republican win. Harry S. Truman stunned the country, defeating Thomas E. Dewey in one of the biggest upsets in U.S. history. A third color appears too. This was Strom Thurmond’s Dixiecrat states in the Deep South, breaking away over civil rights.
Map Information
US Election Maps
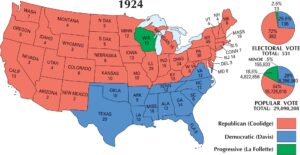
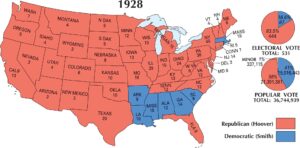
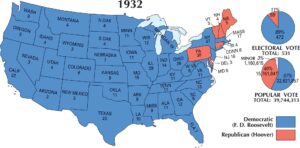
Click on a map below to check out the US election map and results.
On the Map
The 1948 Presidential Election is famous for being one of the greatest upsets in American history. Harry S. Truman (Democrat) secured a full term by defeating Thomas E. Dewey (Republican) and overcoming a significant split within his own party.
States and Electoral Votes
|
State |
Total Votes |
Truman (D) |
Dewey (R) |
Thurmond (SRD) |
|
New York |
47 |
0 |
47 |
0 |
|
Pennsylvania |
35 |
0 |
35 |
0 |
|
California |
25 |
25 |
0 |
0 |
|
Illinois |
28 |
28 |
0 |
0 |
|
Ohio |
25 |
25 |
0 |
0 |
|
Texas |
23 |
23 |
0 |
0 |
|
Michigan |
19 |
0 |
19 |
0 |
|
Massachusetts |
16 |
16 |
0 |
0 |
|
New Jersey |
16 |
0 |
16 |
0 |
|
Missouri |
15 |
15 |
0 |
0 |
|
North Carolina |
14 |
14 |
0 |
0 |
|
Indiana |
13 |
0 |
13 |
0 |
|
Georgia |
12 |
12 |
0 |
0 |
|
Wisconsin |
12 |
12 |
0 |
0 |
|
Tennessee |
12 |
11 (+1 SRD) |
0 |
1 |
|
Virginia |
11 |
11 |
0 |
0 |
|
Alabama |
11 |
0 |
0 |
11 |
|
Kentucky |
11 |
11 |
0 |
0 |
|
Minnesota |
11 |
11 |
0 |
0 |
|
Iowa |
10 |
10 |
0 |
0 |
|
Louisiana |
10 |
0 |
0 |
10 |
|
Oklahoma |
10 |
10 |
0 |
0 |
|
Arkansas |
9 |
9 |
0 |
0 |
|
Mississippi |
9 |
0 |
0 |
9 |
|
Florida |
8 |
8 |
0 |
0 |
|
Maryland |
8 |
0 |
8 |
0 |
|
South Carolina |
8 |
0 |
0 |
8 |
|
Washington |
8 |
8 |
0 |
0 |
|
West Virginia |
8 |
8 |
0 |
0 |
|
Connecticut |
8 |
0 |
8 |
0 |
|
Kansas |
8 |
0 |
8 |
0 |
|
Nebraska |
6 |
0 |
6 |
0 |
|
Colorado |
6 |
6 |
0 |
0 |
|
Oregon |
6 |
0 |
6 |
0 |
|
Maine |
5 |
0 |
5 |
0 |
|
Rhode Island |
4 |
4 |
0 |
0 |
|
South Dakota |
4 |
0 |
4 |
0 |
|
North Dakota |
4 |
0 |
4 |
0 |
|
Montana |
4 |
4 |
0 |
0 |
|
Utah |
4 |
4 |
0 |
0 |
|
New Mexico |
4 |
4 |
0 |
0 |
|
Idaho |
4 |
4 |
0 |
0 |
|
Arizona |
4 |
4 |
0 |
0 |
|
New Hampshire |
4 |
0 |
4 |
0 |
|
Vermont |
3 |
0 |
3 |
0 |
|
Delaware |
3 |
0 |
3 |
0 |
|
Wyoming |
3 |
3 |
0 |
0 |
|
Nevada |
3 |
3 |
0 |
0 |
Election Summary
- The Winner: Harry S. Truman (Democrat) defied polling predictions to win 303 electoral votes (57%).
- The Main Challenger: Thomas E. Dewey (Republican), who many experts thought would win easily, secured 189 electoral votes (35.5%).
- The Third Party Factor: Strom Thurmond, running for the States’ Rights Democratic Party (Dixiecrats), won 39 electoral votes (7.5%) after Southern delegates walked out of the Democratic National Convention over civil rights platform issues.
- Popular Vote: Truman won 49.5% (24,105,812) to Dewey’s 45% (21,970,065). Thurmond and Progressive candidate Henry Wallace each received roughly 1.1 million votes (2.5% each).
- Historical Significance: This election saw the first major fracture in the “Solid South” since the 1920s, as Thurmond carried South Carolina, Mississippi, Alabama, and Louisiana.