US Election 1960 Map
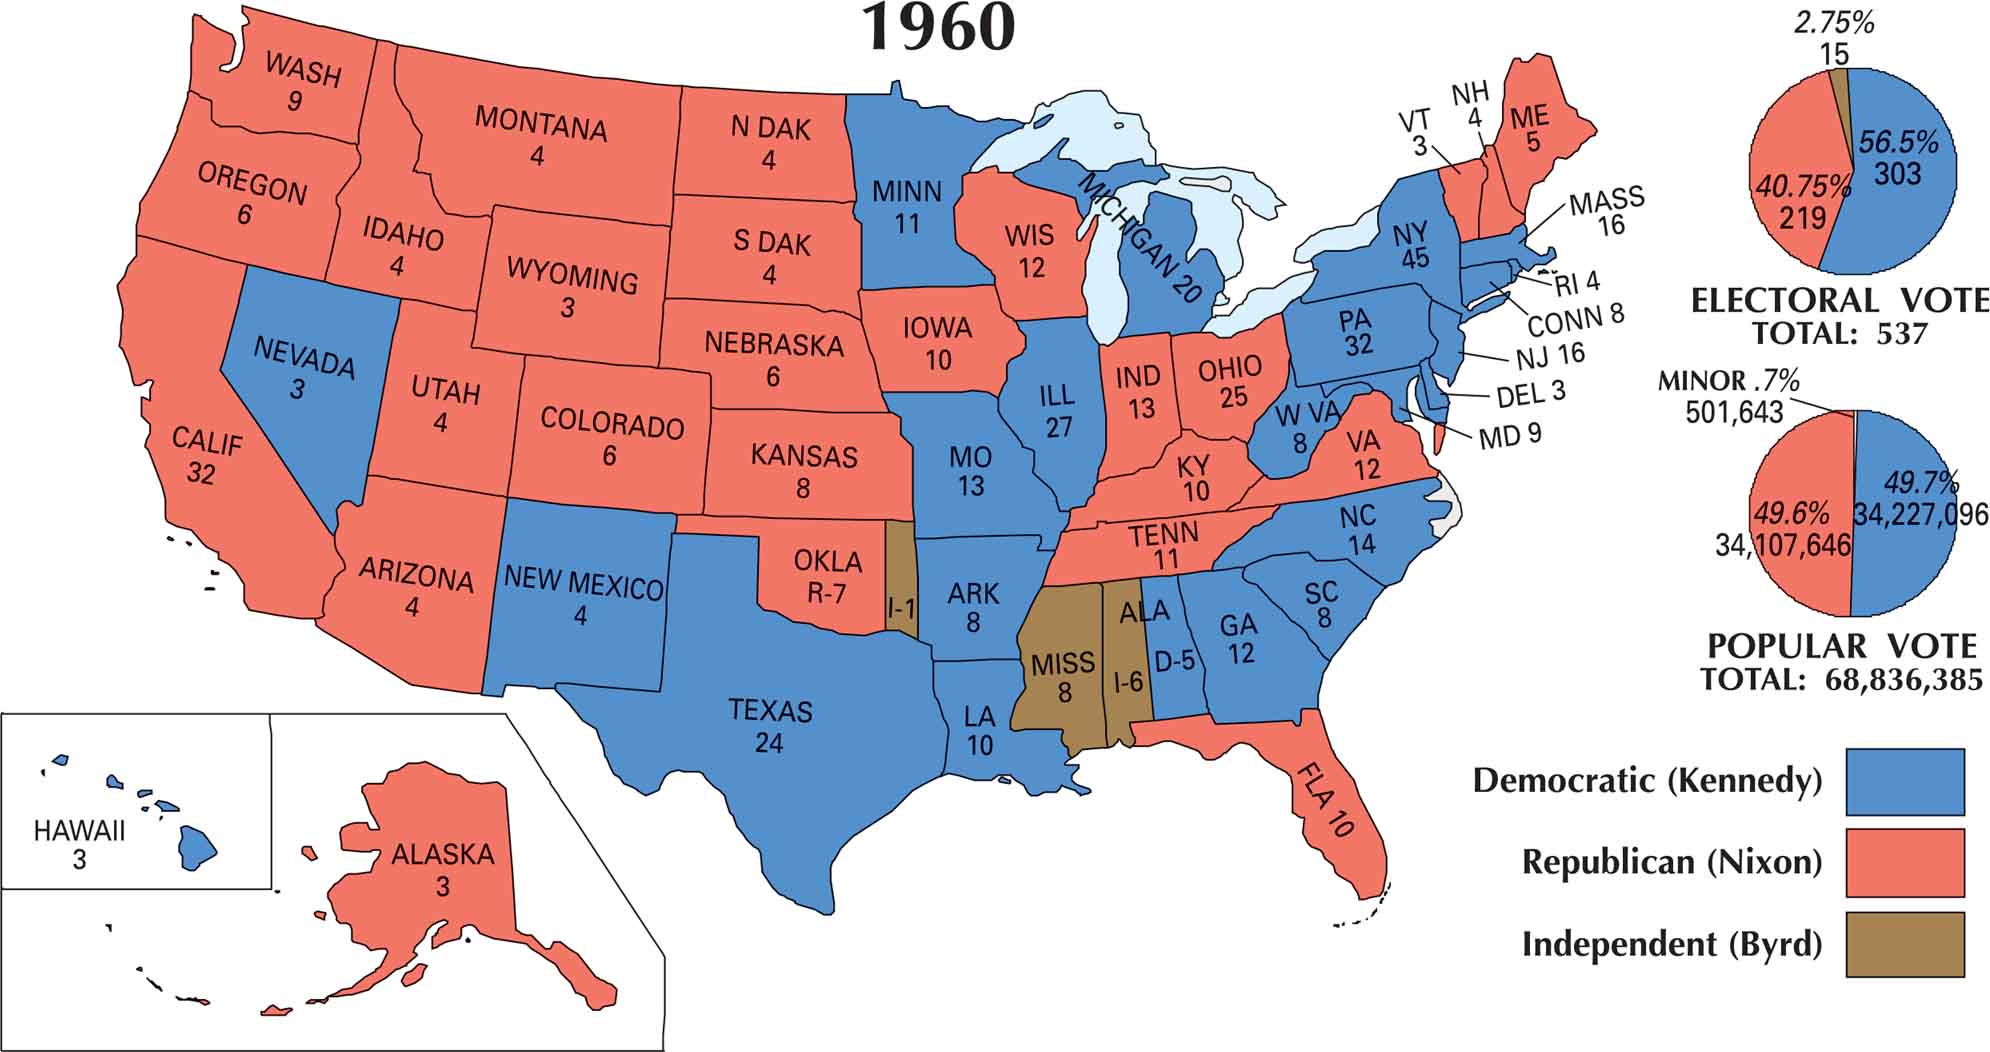
The 1960 US election map looks almost split down the middle. Red and blue are scattered in near balance. But John F. Kennedy edged out Richard Nixon in one of the tightest races in U.S. history. Kennedy’s blue runs through the South and the industrial Northeast. Nixon’s red stretches across much of the Midwest and West.
Map Information
US Election Maps
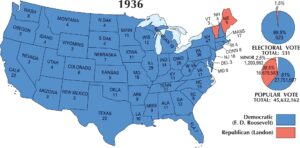
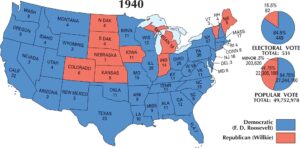
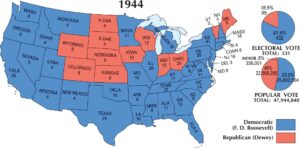
Click on a map below to check out the US election map and results.
On the Map
The 1960 Presidential Election was one of the closest in American history, featuring the first televised debates between John F. Kennedy (Democrat) and Richard Nixon (Republican). Kennedy’s narrow victory marked the first time a Roman Catholic was elected President and saw the inclusion of two new states, Alaska and Hawaii, in the electoral process.
States and Electoral Votes
|
State |
Total Votes |
Kennedy (D) |
Nixon (R) |
Byrd (I) |
|
New York |
45 |
45 |
0 |
0 |
|
Pennsylvania |
32 |
32 |
0 |
0 |
|
California |
32 |
0 |
32 |
0 |
|
Illinois |
27 |
27 |
0 |
0 |
|
Ohio |
25 |
0 |
25 |
0 |
|
Texas |
24 |
24 |
0 |
0 |
|
Michigan |
20 |
20 |
0 |
0 |
|
Massachusetts |
16 |
16 |
0 |
0 |
|
New Jersey |
16 |
16 |
0 |
0 |
|
North Carolina |
14 |
14 |
0 |
0 |
|
Indiana |
13 |
0 |
13 |
0 |
|
Missouri |
13 |
13 |
0 |
0 |
|
Georgia |
12 |
12 |
0 |
0 |
|
Wisconsin |
12 |
0 |
12 |
0 |
|
Virginia |
12 |
0 |
12 |
0 |
|
Tennessee |
11 |
0 |
11 |
0 |
|
Alabama |
11 |
5 |
0 |
6 |
|
Minnesota |
11 |
11 |
0 |
0 |
|
Kentucky |
10 |
0 |
10 |
0 |
|
Florida |
10 |
0 |
10 |
0 |
|
Iowa |
10 |
0 |
10 |
0 |
|
Louisiana |
10 |
10 |
0 |
0 |
|
Washington |
9 |
0 |
9 |
0 |
|
Maryland |
9 |
9 |
0 |
0 |
|
Oklahoma |
8 |
0 |
7 |
1 |
|
South Carolina |
8 |
8 |
0 |
0 |
|
Connecticut |
8 |
8 |
0 |
0 |
|
West Virginia |
8 |
8 |
0 |
0 |
|
Arkansas |
8 |
8 |
0 |
0 |
|
Mississippi |
8 |
0 |
0 |
8 |
|
Kansas |
8 |
0 |
8 |
0 |
|
Oregon |
6 |
0 |
6 |
0 |
|
Colorado |
6 |
0 |
6 |
0 |
|
Nebraska |
6 |
0 |
6 |
0 |
|
Maine |
5 |
0 |
5 |
0 |
|
Rhode Island |
4 |
4 |
0 |
0 |
|
South Dakota |
4 |
0 |
4 |
0 |
|
North Dakota |
4 |
0 |
4 |
0 |
|
Montana |
4 |
0 |
4 |
0 |
|
Utah |
4 |
0 |
4 |
0 |
|
New Mexico |
4 |
4 |
0 |
0 |
|
Idaho |
4 |
0 |
4 |
0 |
|
Arizona |
4 |
0 |
4 |
0 |
|
New Hampshire |
4 |
0 |
4 |
0 |
|
Vermont |
3 |
0 |
3 |
0 |
|
Delaware |
3 |
3 |
0 |
0 |
|
Wyoming |
3 |
0 |
3 |
0 |
|
Nevada |
3 |
3 |
0 |
0 |
|
Alaska |
3 |
0 |
3 |
0 |
|
Hawaii |
3 |
3 |
0 |
0 |
Election Summary
- The Winner: John F. Kennedy (Democrat) won with 303 electoral votes (56.5%).
- The Challenger: Richard Nixon (Republican) secured 219 electoral votes (40.75%).
- Popular Vote: This was exceptionally tight, with Kennedy receiving 49.7% (34,227,096) and Nixon 49.6% (34,107,646).
- New States: For the first time, Alaska (3 votes, Republican) and Hawaii (3 votes, Democratic) participated in a presidential election.